We are excited to announce our €2.3 Million Pre-seed round led by Earlybird-X! →
How people analytics can help improve diversity, equity and inclusion
12 May

Business success through DEI
Diversity, equity and inclusion (DEI) is about more than just increasing the numbers of people from different demographic groups. It is about business success through employees.
According to the results of the joint study by the German Retail Association (HDE), the auditing and consulting firm PwC Germany and Google Germany, 40% of companies already see added value in diverse teams. This suggests that companies understand the importance of a diverse team with different backgrounds and experiences. Despite this, only two percent of the companies surveyed said they had implemented DEI in their corporate strategy.
In addition, reporting guidelines are tightening for companies in the DEI space as well. Organizations are now beginning to prepare for CRSD sustainability reporting, but are encountering many challenges in meeting the reporting requirement.
How People Analytics helps you achieve your DEI goals
With the help of our platform, you’ll have all of your employees’ data from all of your HR systems at your fingertips and can view trends directly. You want to test our platform? Sign up for a free demo here.
For your data analytics, we’ve built key DEI metrics and reports into our platform so you can define the right actions for your organization to achieve your DEI goals. This allows you to assess the progress and impact of diversity, equity, and inclusion strategies in the workplace in real time. They will help you understand the current state of DEI in your organization and identify areas that need improvement. You can find an overview of all DEI metrics in our metrics library.
But how can metrics specifically help you achieve your DEI goals?
By knowing metrics such as promotion rate by demographics, percentage of diversity in senior management, and gender pay gap for your organization, you can develop the right DEI measures to make the organization more diverse, equitable, and therefore more productive.
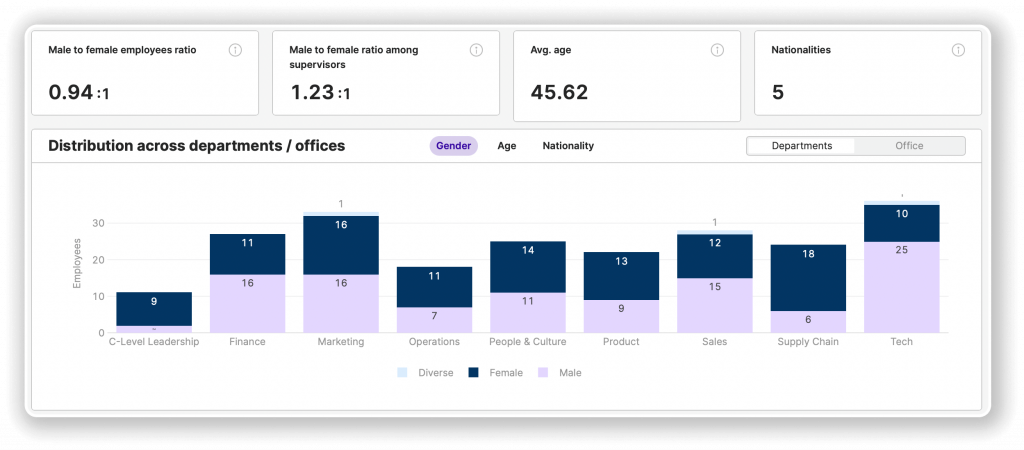
For example, let’s say you want to find out how diverse the different departments in your company are. To do this, you need to analyze the data of your employees. If we do it for you, it might look like this:

Now you can see from the evaluation that the gender distribution in our demo company varies greatly, especially in the areas of C-level leadership, supply chain, and tech. This can lead to an inequality in representation and potentially a lack of diversity and perspective. This is where People Analytics can fix the problem, using analytics to monitor and optimize gender distribution in each department.
By leveraging the data, you can take targeted action to ensure that each department has a balanced gender distribution.
Further cases?
Curious about other cases where people analytics can help you achieve your DEI goals? Then check out our DEI use cases. Or request a personalized demo on your individual challenges and we’ll discuss your company’s specific needs.
Recent Posts

Insight: Gender Pay Gap
February 12, 2025
The Challenges of People Analytics
November 12, 2024
People Analytics: Benefits, Origins & Best Practices
November 12, 2024Categories
- Analytics (2)
- Collaboration (1)
- Customer Sucess Stories (1)
- Data Management (1)
- Foundations (9)
- Human Resources (HR) (3)
- Platform (1)
- Recession Times (2)
- Tech Stack (1)
- Uncategorized (7)
- Use Cases (4)
PRODUCT
People Planning & Scenarios
Sharing & Collaboration
RESOURCES
STAY IN THE LOOP
Copyright © 2024 peopleIX GmbH. All rights reserved.


