In this report, we explore how employees' sickness rates are changing over time, which groups are most affected, and how seasonal patterns, as well as gender and age differences, play a role in these trends.
Introduction
In this report, we took a deep dive into sickness rates across about 7,000 employees over two years (2023-2024). We spotted some interesting trends: sickness rates by gender, age, and season. The key takeaways? Sickness rates are on the rise year after year, there are clear gender differences, and seasons definitely play a role.
This analysis aims to answer critical questions:
How do sickness rates vary by gender and age group?
What seasonal trends can be observed?
What insights can businesses derive to improve workforce management and support?
Key findings include:
A year-over-year (YOY) increase in overall sickness rates from 2.99% in 2023 to 3.43% in 2024
Gender-specific disparities, with female employees consistently reporting higher sickness rates.
Seasonal peaks in winter and summer, particularly among younger (20–29) and older (50+) employees.
The analysis conducted is based on a robust dataset drawn from a diverse employee pool of approximately 7,000 individuals working in Germany. This pool reflects a wide range of demographics, providing valuable insights into workforce trends and sickness rates across different groups.
What can we learn from these trends, and how can organizations use this information to support their workforce effectively?
Let’s explore each takeaway in detail.
Part 1:
Gender-Specific Trends
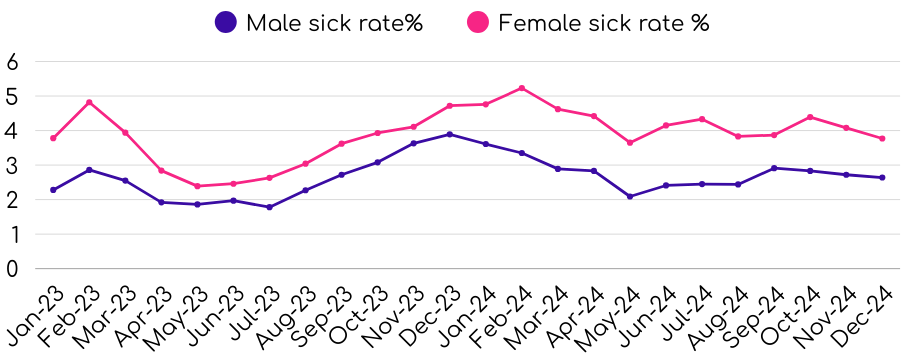
Our analysis found clear differences in sickness rates between male and female employees over the two years. While both genders experienced an increase in absenteeism YOY, females consistently reported higher monthly sickness rates.
Key Observations
Female employees recorded higher sickness rates across both years, particularly during summer months. This trend may be influenced by environmental factors or family-related responsibilities such as childcare during school breaks.
With peopleIX’s analytics tools, organizations can track gender-specific absenteeism trends and identify potential causes to address disparities effectively.
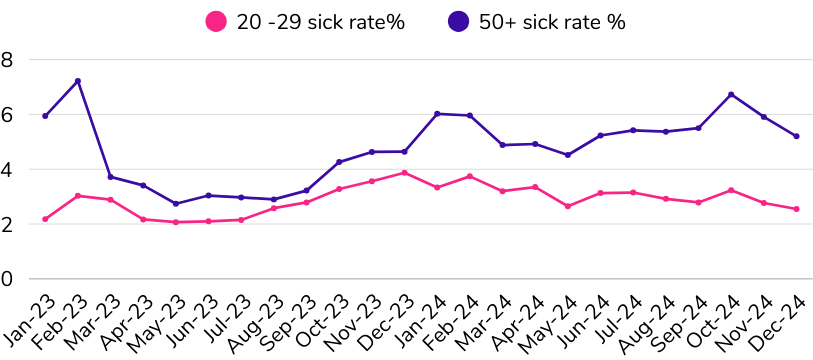
Sickness rates varied significantly across age groups, with younger (20–29) and older (50+) employees showing the highest increases YOY.
Key Observations
Older employees (50+) recorded the highest sickness rates, particularly during summer months, possibly due to caregiving responsibilities for children or grandchildren during school holidays. Younger employees (20–29) showed peaks after intense work periods tied to seasonal business activities like Black Friday or event preparation
peopleIX enables organizations to analyze age-specific trends and implement targeted measures to support employee well-being across different demographics.
🎧 Podcast Feature: Sick Days & Productivity – Who’s Really in Control?
Sick leave in German companies – What does it really say about productivity?
Part 3:
Seasonal Trends
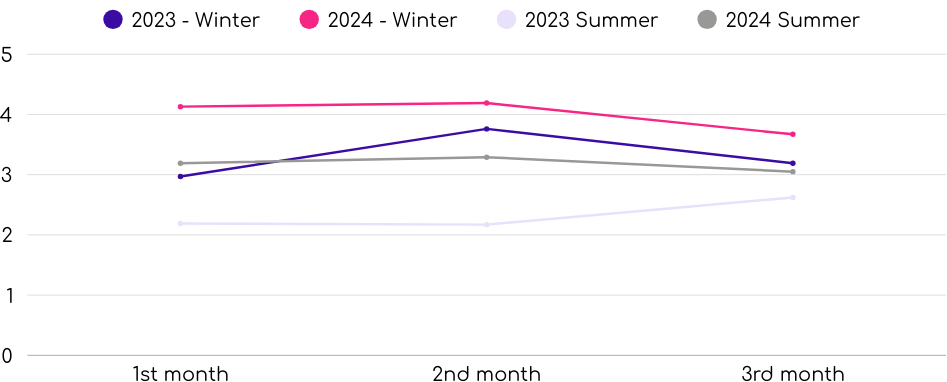
Seasonal variations were evident across all demographics, with winter months showing consistently higher sickness rates compared to summer. Winter months saw the highest sickness rates across all groups due to common illnesses like flu, while summer showed sharper increases for specific demographics such as females and older employees.
Key Observations
Seasonal peaks highlight the need for proactive health initiatives during high-stress periods like winter flu season or summer caregiving responsibilities.
1st month : Jan & June
2nd month: Feb & July
3rd month: Mar & August
With peopleIX’s predictive analytics capabilities, organizations can forecast seasonal absenteeism trends and implement measures to mitigate their impact on productivity.
The analysis on the sickness rate shows that there are some counter intuitive insights, which would need further investigations, to really get to the “actionable” part of the insight. The different sickness rate levels among age groups, and the different seasonalities trend across summer and winter months.
We think that focusing on specific time frames and samples based on age and gender, dividing the sickness reasons, could shed some light on the phenomenon, and help business leaders understand how to mitigate further risks and health related issues, for example the impact of child related care in summer months.
Distinguishing also between short term and long term sickness, could be crucial to split the rate into actionable understandings.