We are excited to announce our €2.3 Million Pre-seed round led by Earlybird-X! →


People
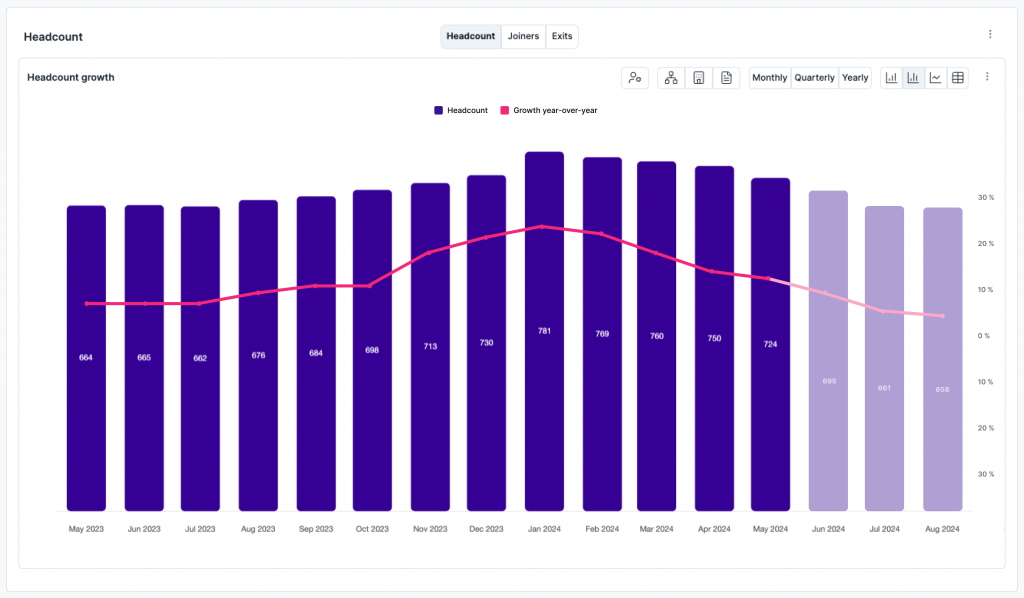
Headcount & Growth: Headcount is the total number of active employees within an organization at a given point in time, in this case per month. Headcount provides a snapshot of the organization’s workforce size and is typically used for reporting, workforce planning, and organizational analysis.
Tracking it can provide insights into workforce size, growth, and productivity.
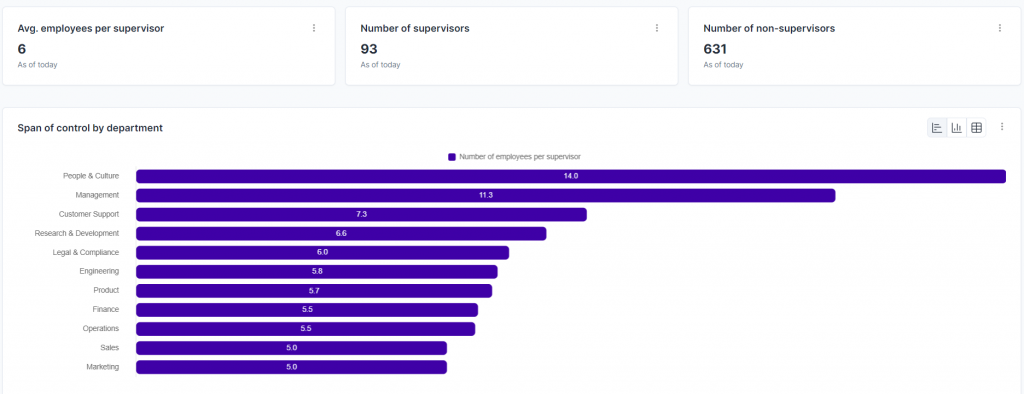
Span of control: Number of employees directly managed by a supervisor or manager. Understanding the span of control helps assess the organizational hierarchy and management efficiency.
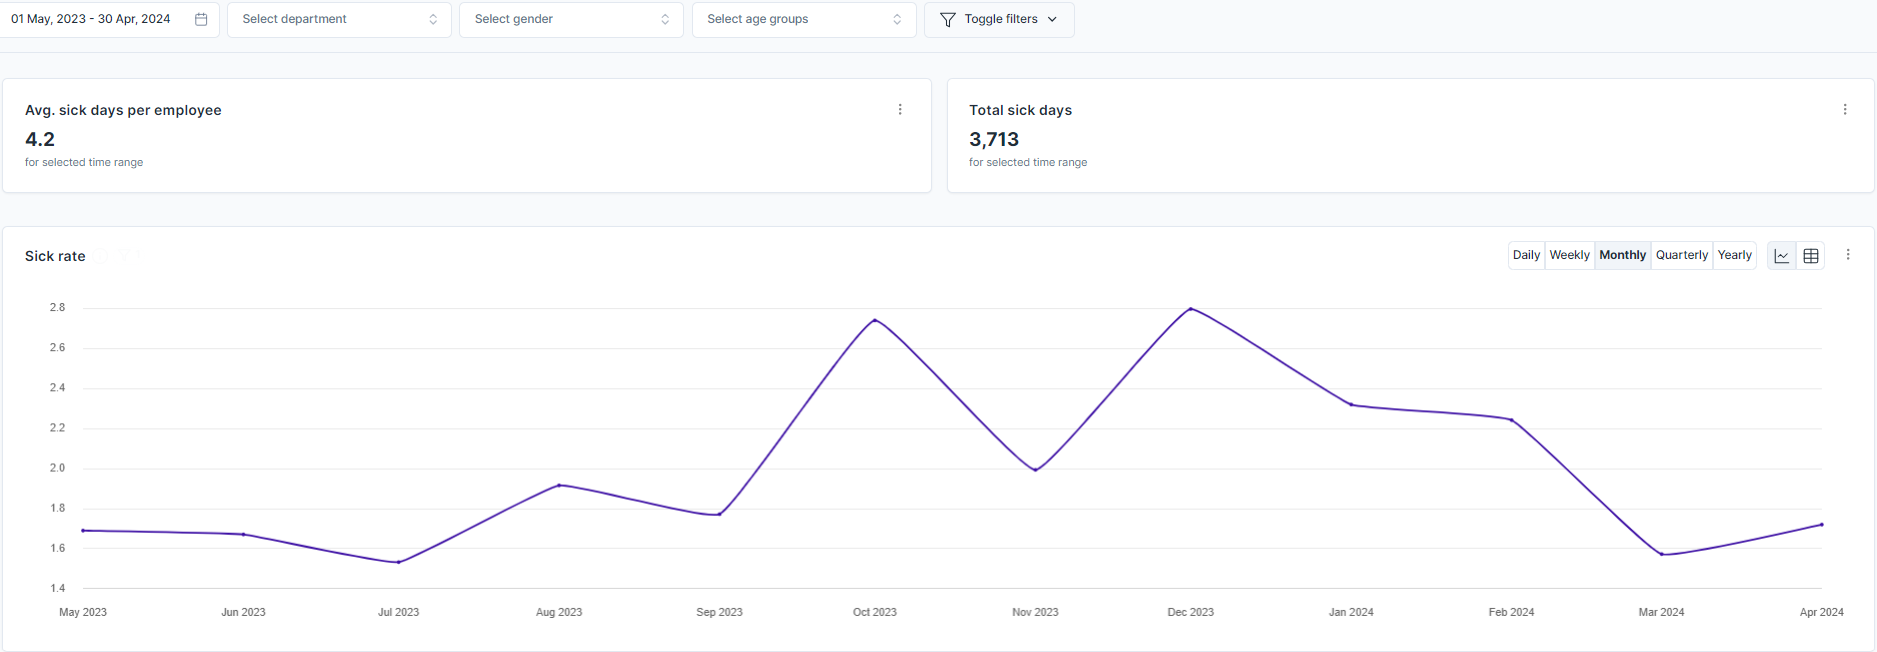
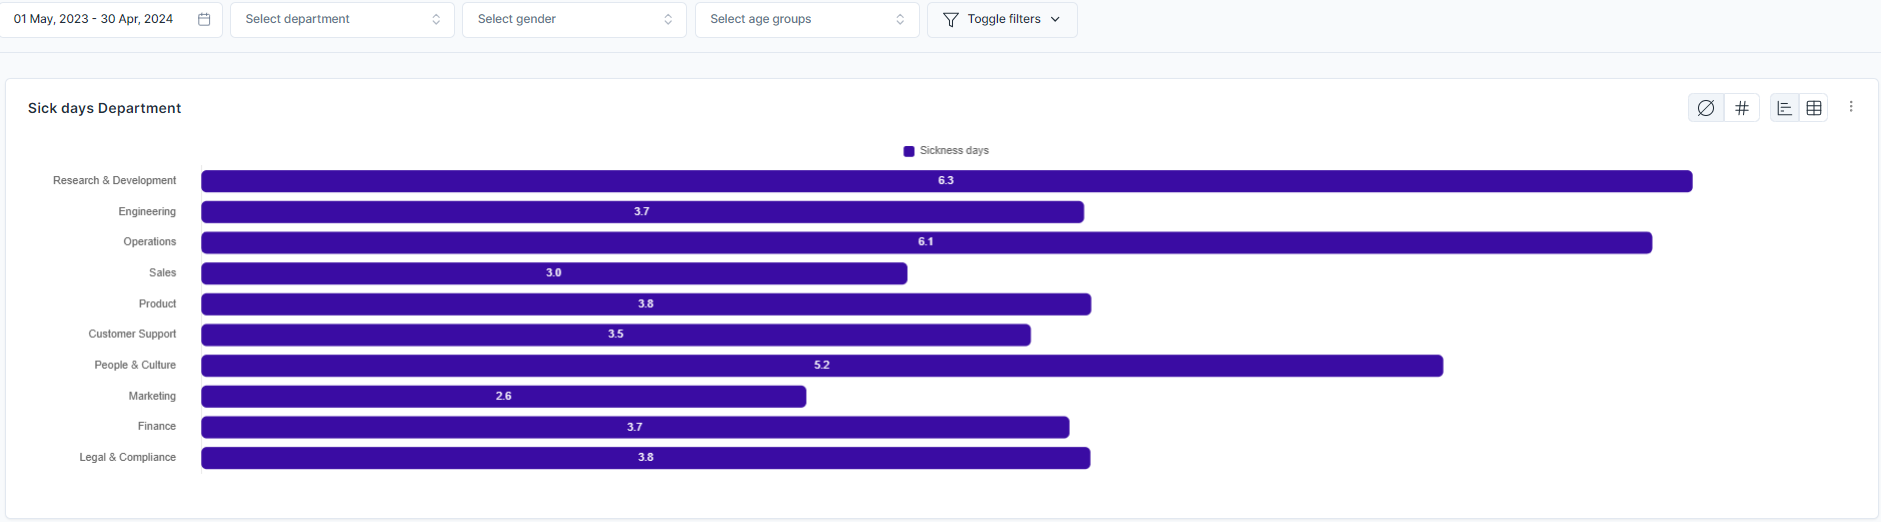
Sick rates: Sick rate is calculated as the total FTE sick days divided by the total FTE working days to determine the percentage of sick days relative to total working days. This metric provides insight into the health and well-being of a workforce by showing the percentage of time employees are unable to work due to illness relative to their total work capacity.
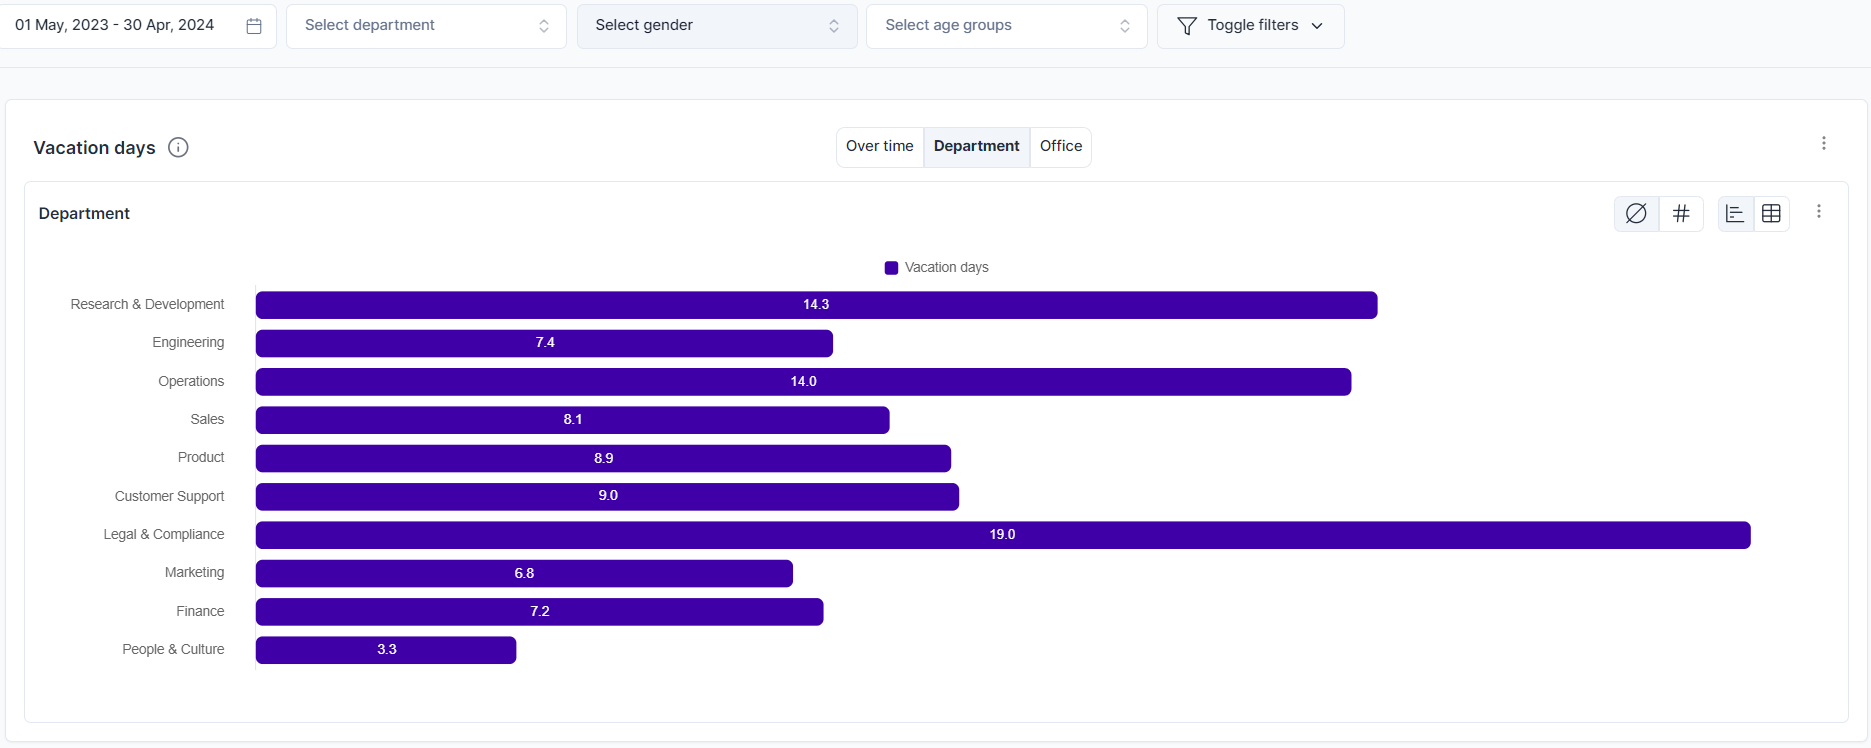
Vacation days: Total number of vacation days taken by employees, whether compensated or not, over a specific period. Monitoring this metric allows organizations to manage workforce availability and plan for peak times, helping to maintain operational effectiveness.
Retention
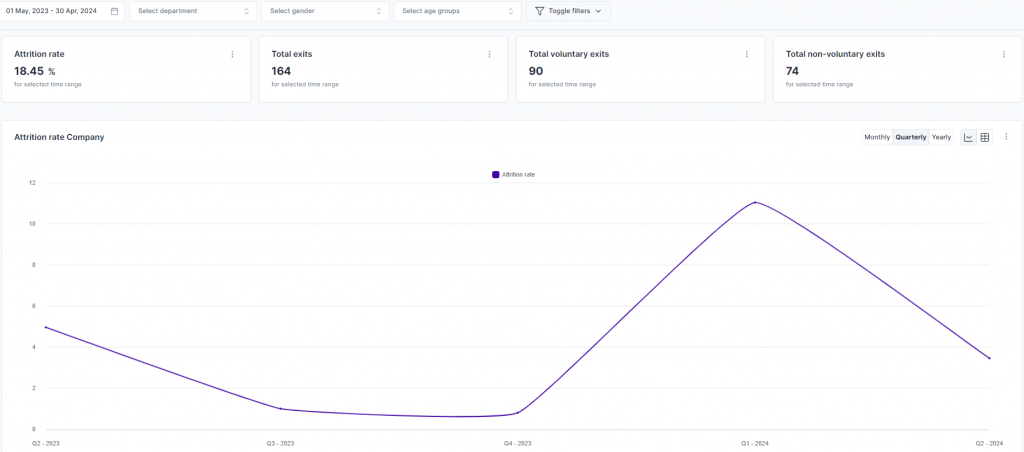
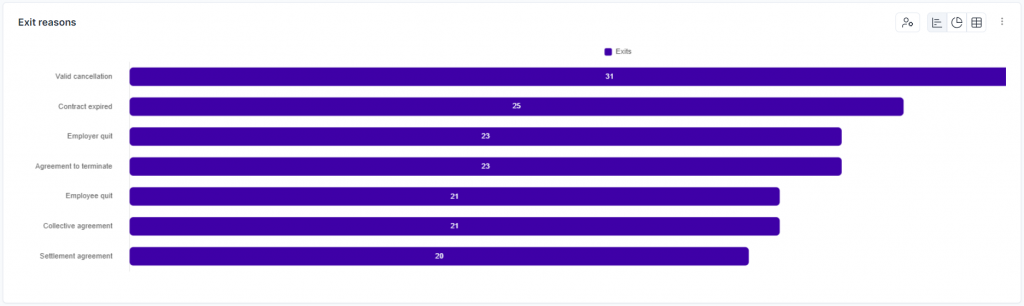
Attrition rate and exit reasons: The attrition rate is the percentage of employees who have left the organization over a given period. Measuring the attrition rate is crucial for identifying issues related to employee satisfaction, engagement, and organizational culture, which aids in retaining talent and maintaining workforce stability. It helps manage costs associated with recruitment and training, providing insights for effective workforce planning and budget management. Additionally, understanding attrition rates can highlight systemic problems and competitive disadvantages, enabling targeted interventions for improving organizational health and employee development.
Diversity, Equity & Inclusion
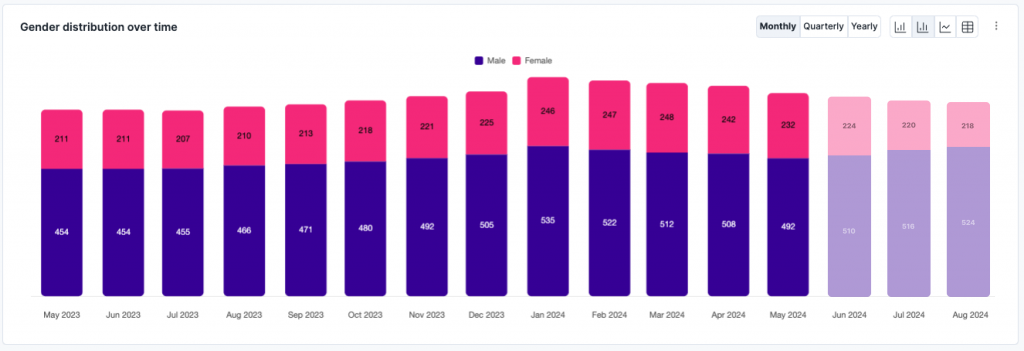
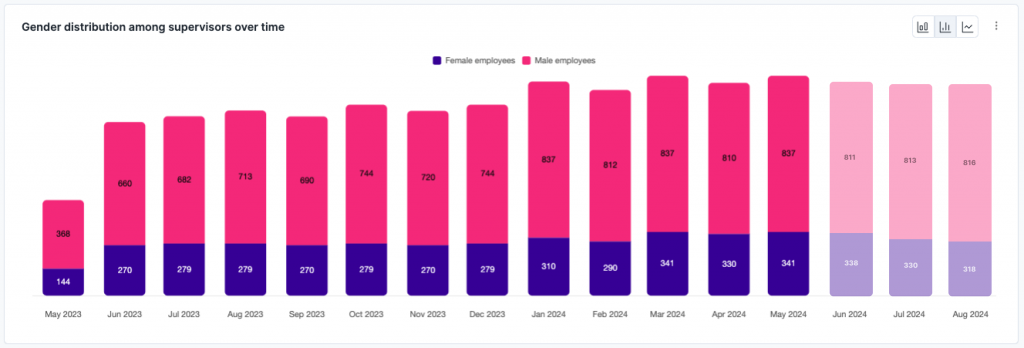
Gender distribution: Distribution and changes in gender demographics over a period. Offering insights into gender diversity trends, equality initiatives, and potential areas for addressing gender imbalances within the organization.
Nationality distribution: Refers to the changing composition of employee nationalities within an organization over a specified period. Monitoring this can help an organization understand its diversity levels, and adapt strategies to create a more inclusive workplace.

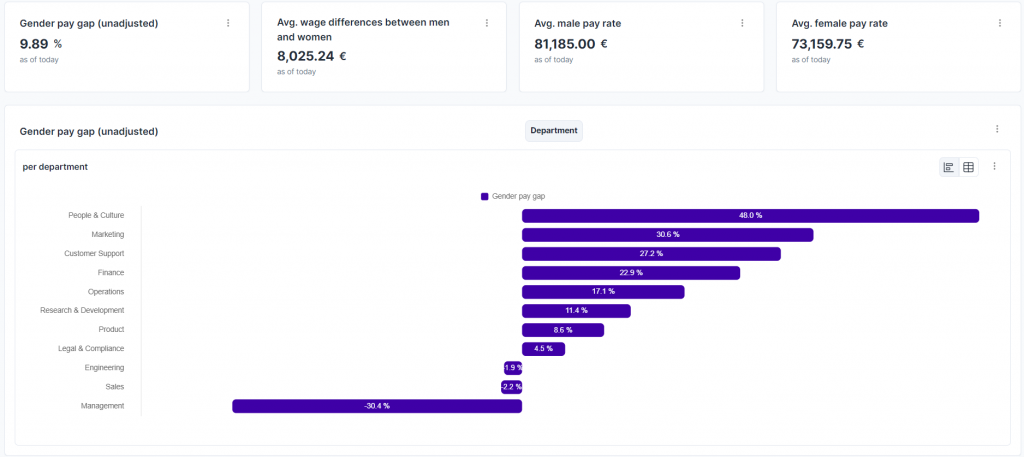
Gender pay gap: Measures the (unadjusted) difference in compensation between women and men. It is expressed as a percentage that represents how much less, on average, women are paid compared to men. A significant gender pay gap can indicate potential issues with pay equity and discrimination within an organization. It can impact employee satisfaction, retention rates, and an organization’s reputation, and may require policy interventions or strategic HR adjustments.
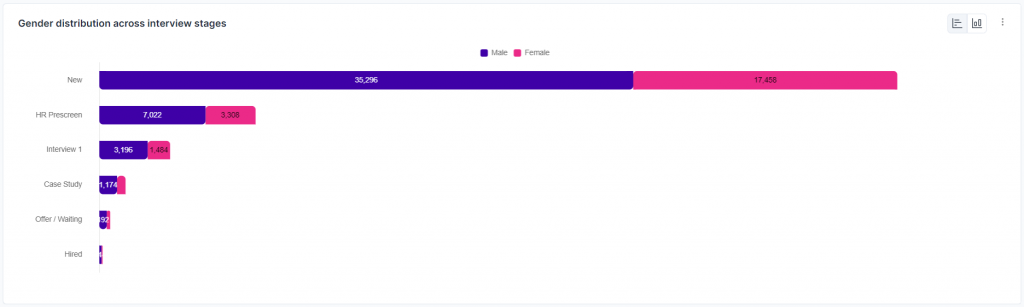
Gender distribution across the recruiting funnel: Genders of the candidates at various stages of the interview process. Monitoring this metric helps identify potential gender biases or bottlenecks in the interview process and aids in developing more equitable hiring practices.
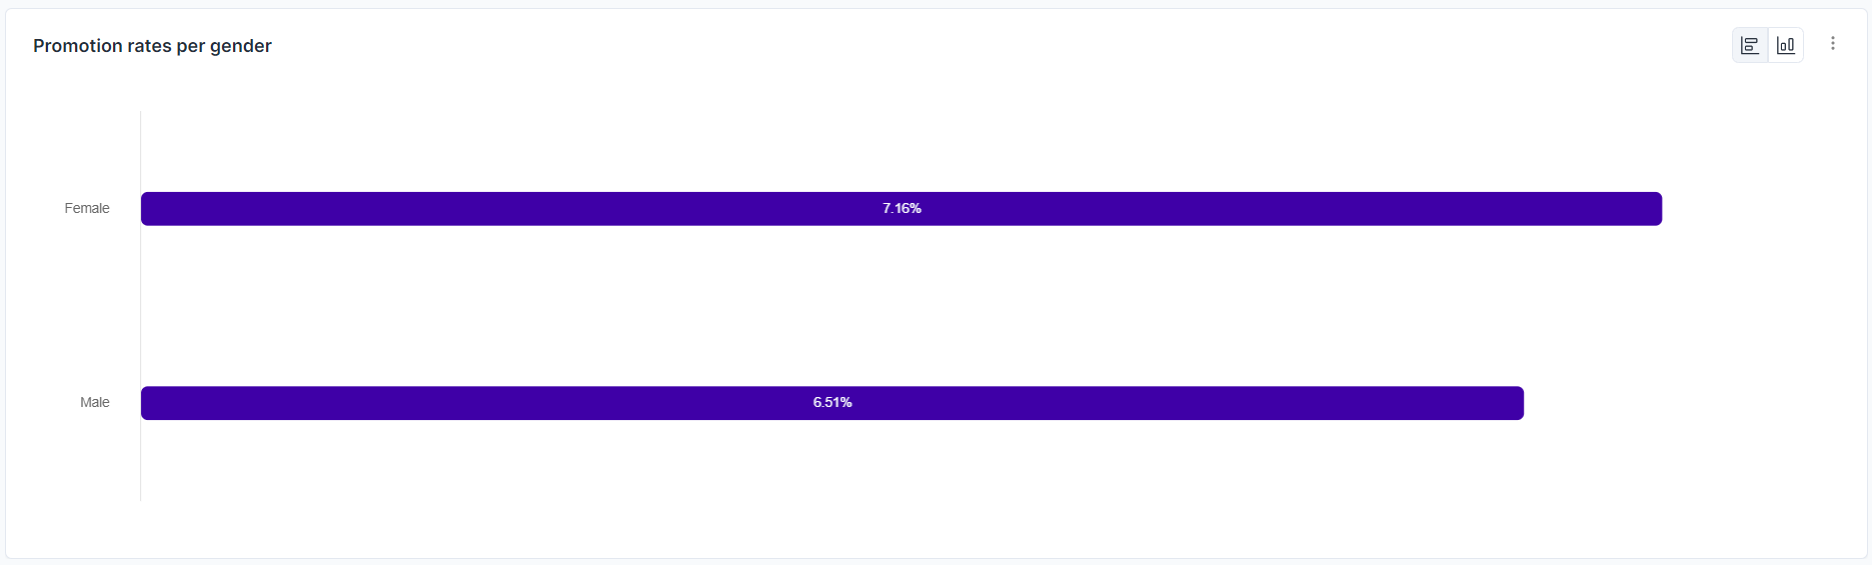
Promotion rates per gender: Promotion rates per gender is a metric that measures the percentage of employees within each gender group who receive a promotion within a specific period. This metric helps organizations assess and ensure equitable career advancement opportunities for all genders, highlighting any disparities in promotion practices. This metric is essential for monitoring gender equality in career progression and for identifying areas where organizational policies or practices may need adjustment to promote fairness and inclusivity.

Made in ![]() with
with ![]()