.webp)


Karen Lindner
Karen's dashboard aims to optimize recruitment and talent management processes in her organization. By closely tracking metrics such as the number of vacancies, conducted interviews, and time-to-hire, Karen ensures efficient allocation of resources and timely decisions. In addition, insights from rejection rates, onboarding success rates, and performance data enable her to refine her recruiting strategies, improve the candidate experience, and strengthen employee loyalty. By comprehensively analyzing these metrics, Karen is able to make informed decisions to optimize talent acquisition and increase workforce productivity and satisfaction.
Karen's dashboard provides insights into:
- Identify bottlenecks in the recruiting process
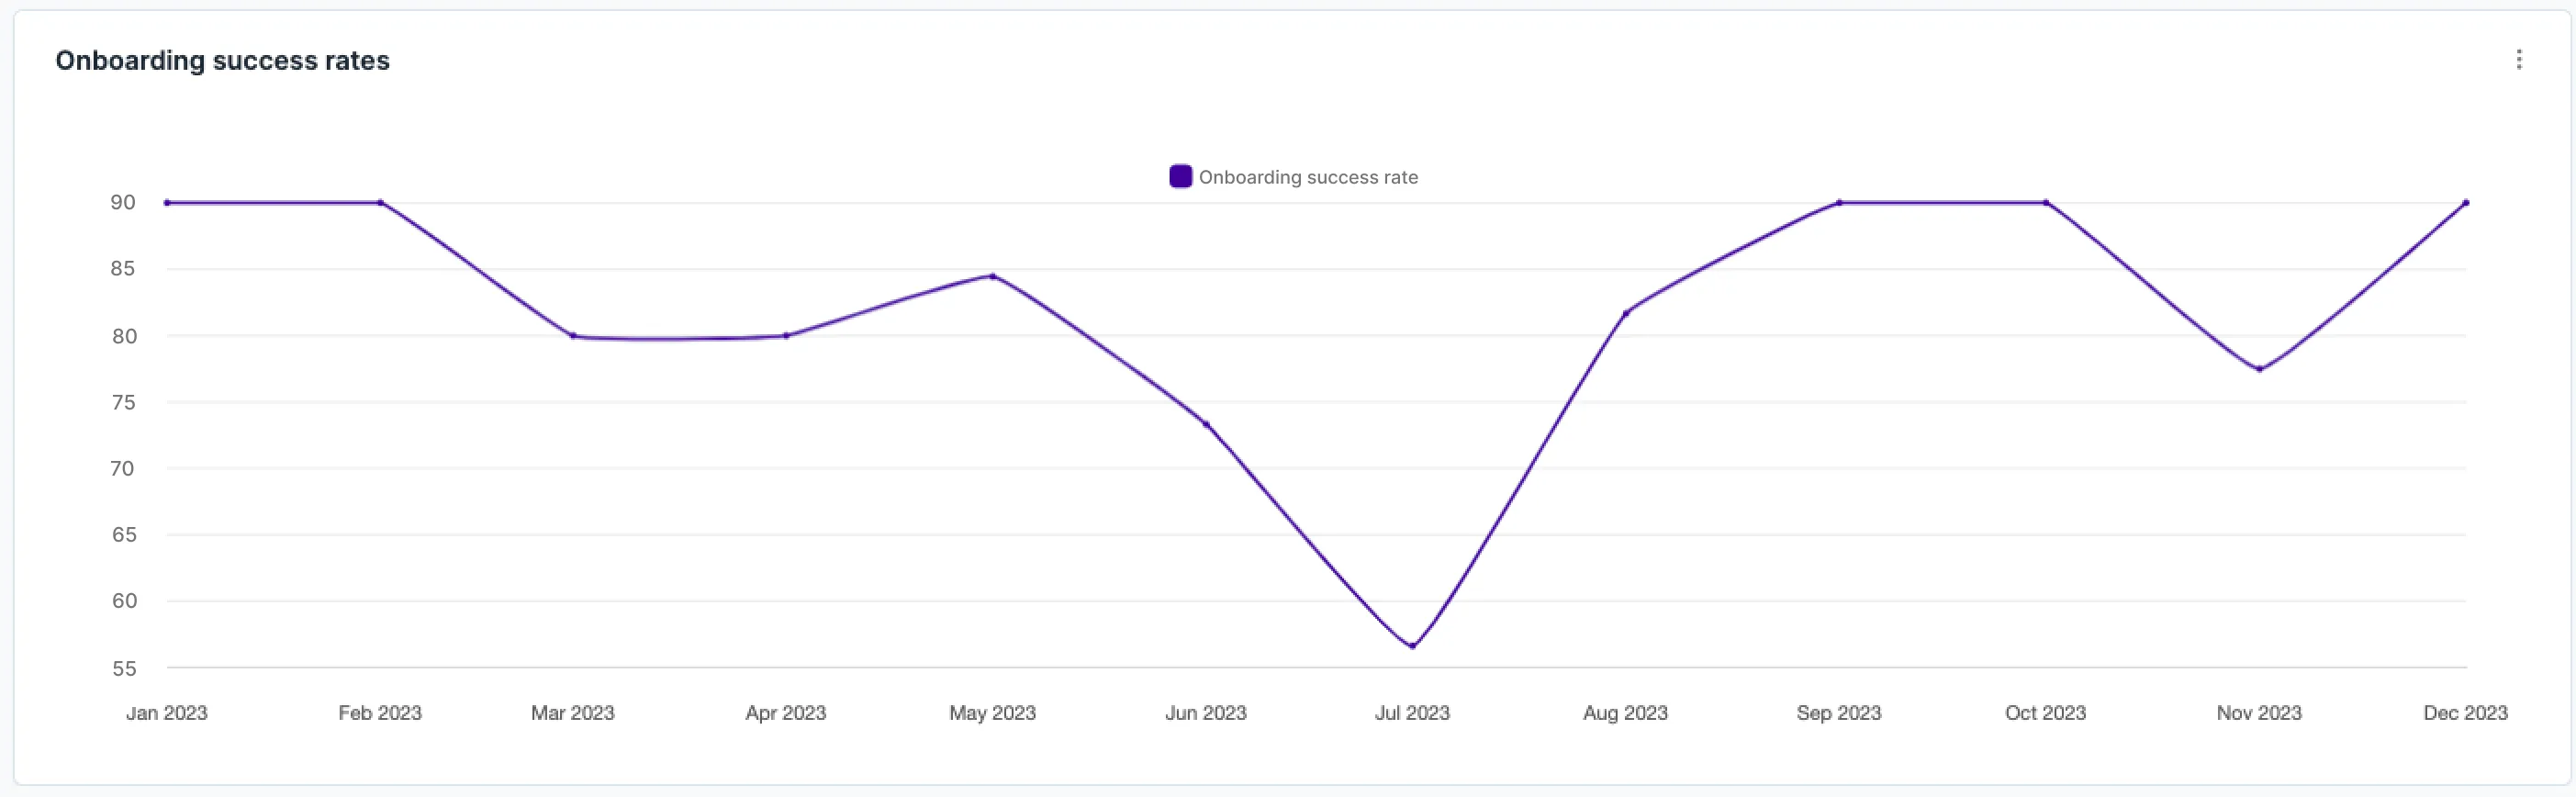
The analysis of recruiting speed indicators such as time-to-hire per department and position helps to derive targeted measures to improve processes. - Evaluate new hires and onboarding
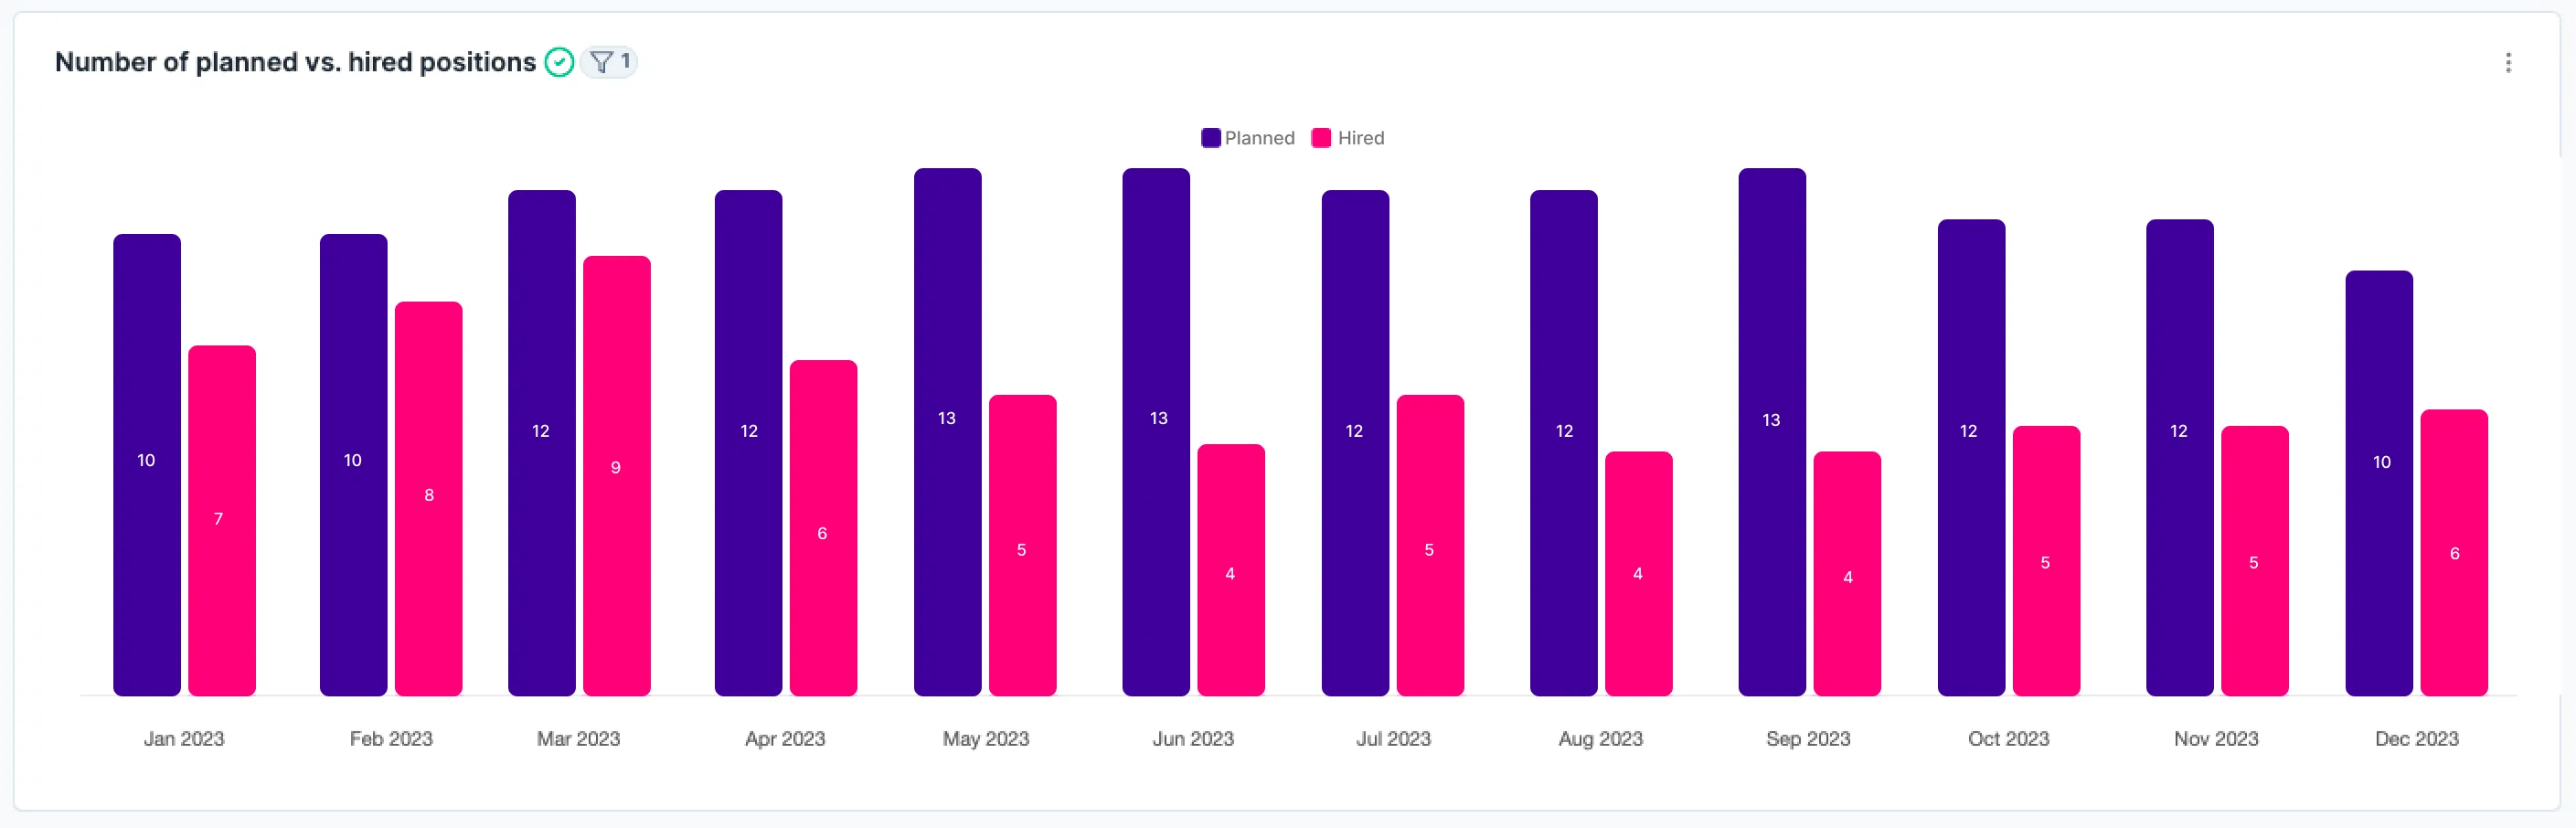
Monitoring retention rates of new employees and success rates in onboarding training provides valuable feedback on the effectiveness of the onboarding process and highlights potential areas for improvement. - Compare planned vs. hired jobs
Karen uses the comparison to check the accuracy of personnel planning and adjust recruiting strategies accordingly.
What does the dashboard include?
Recruiting
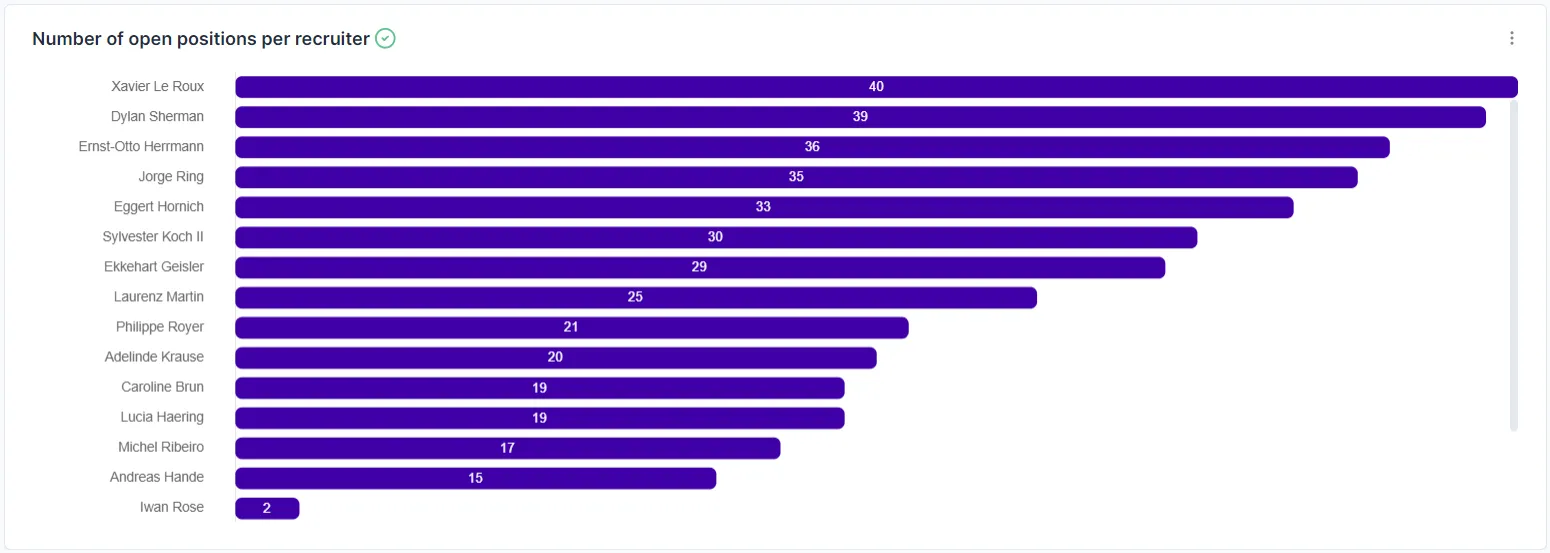
Vacancies: Refers to actively advertised and eligible positions within a specific period of time (e.g. month, quarter, year).
Tracking open positions helps to assess talent requirements and plan targeted recruiting measures.
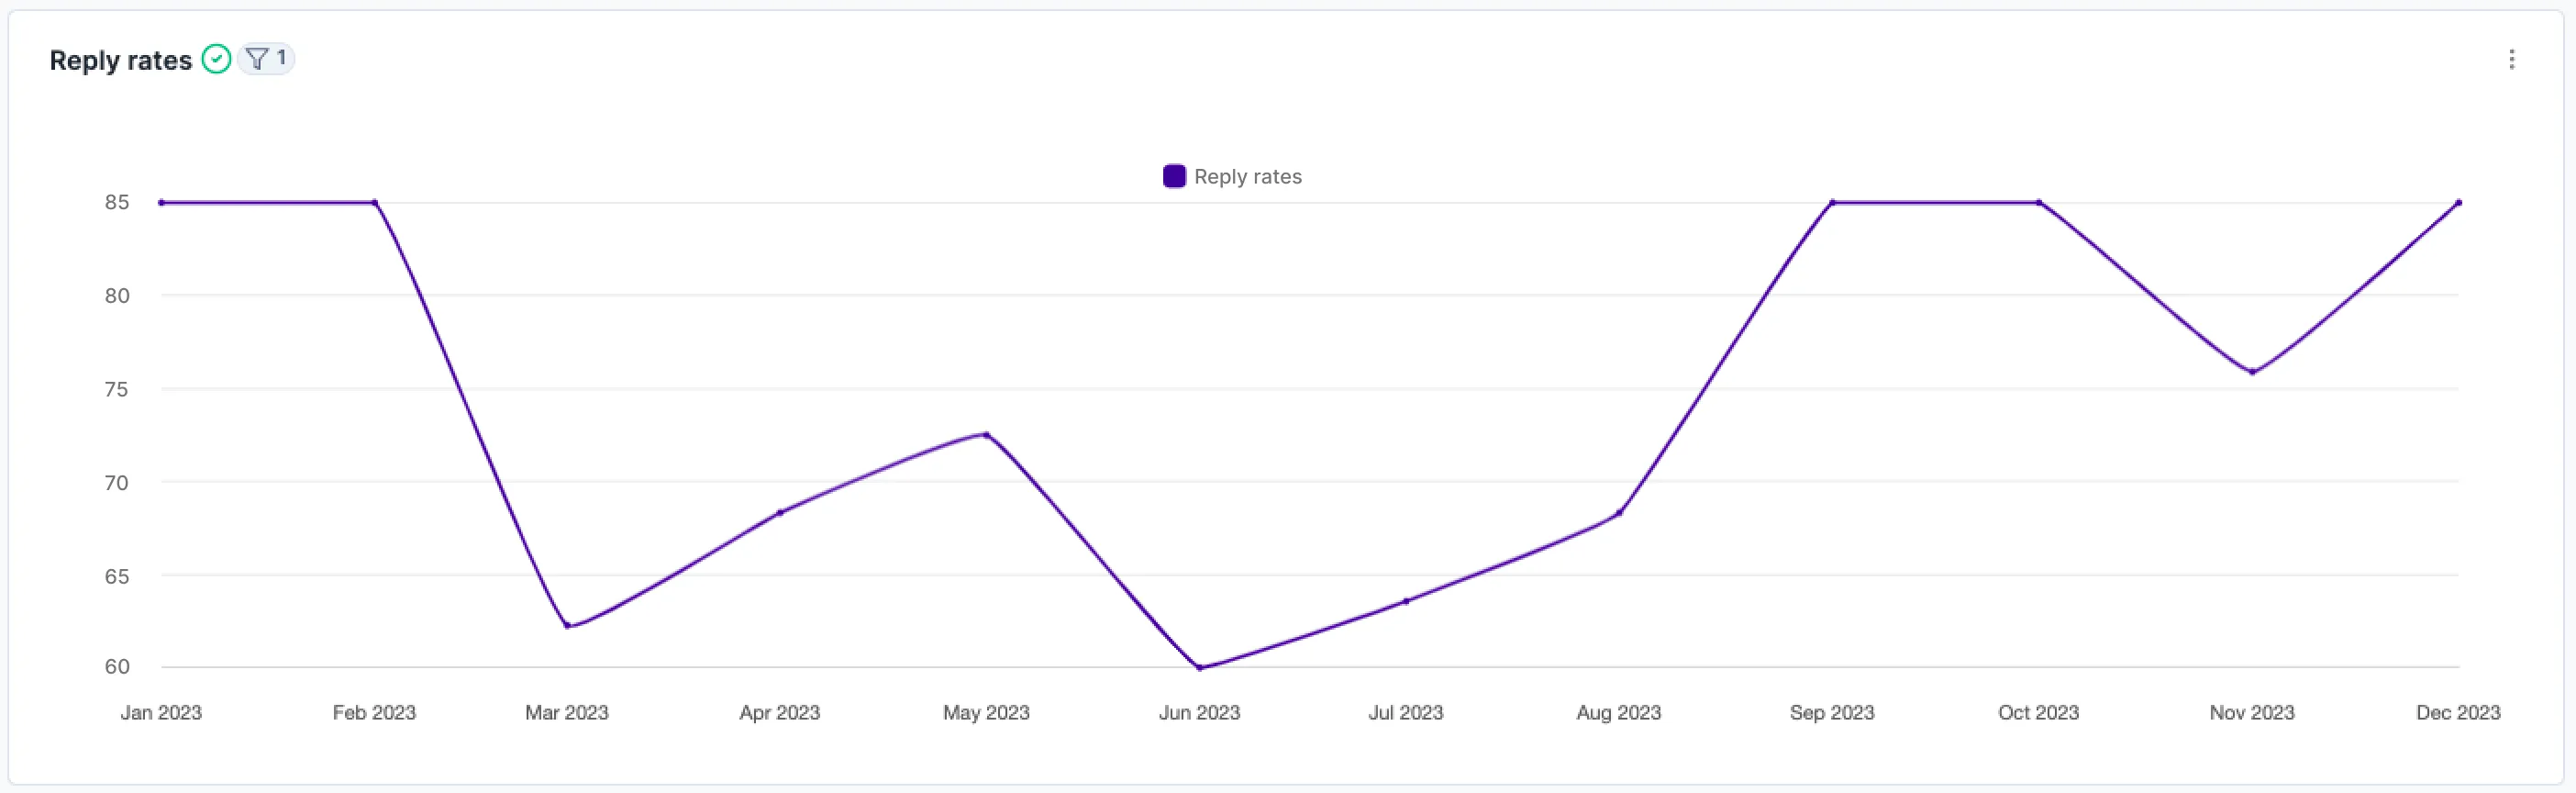
Response rates: Proportion of candidates who respond to recruiters' initial contact attempts
High response rates indicate effective communication and interest, while low rates signal a need for optimization in messaging, targeting, or channels. Improved response rates lead to better talent pools and more efficient recruiting processes.
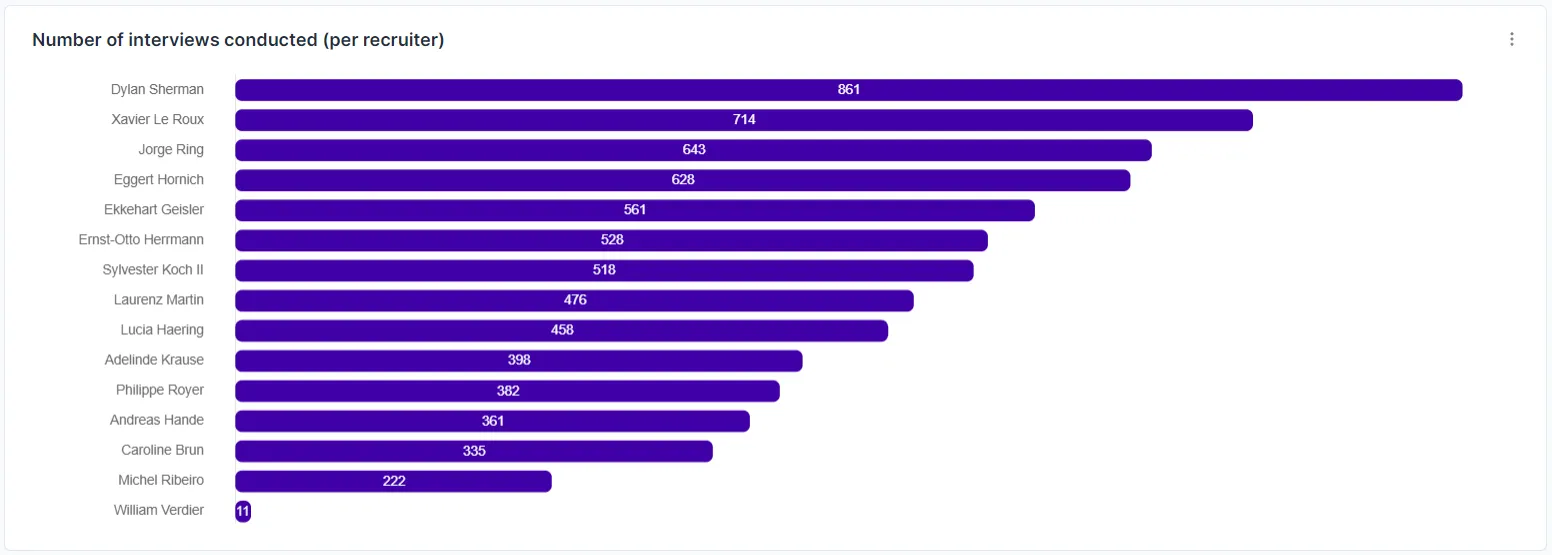
Number of interviews conducted: Total number of interviews conducted over a given period of time.
Provides information about the efficiency of recruiting and commitment of candidates, helps to evaluate sourcing strategies and interview organization.
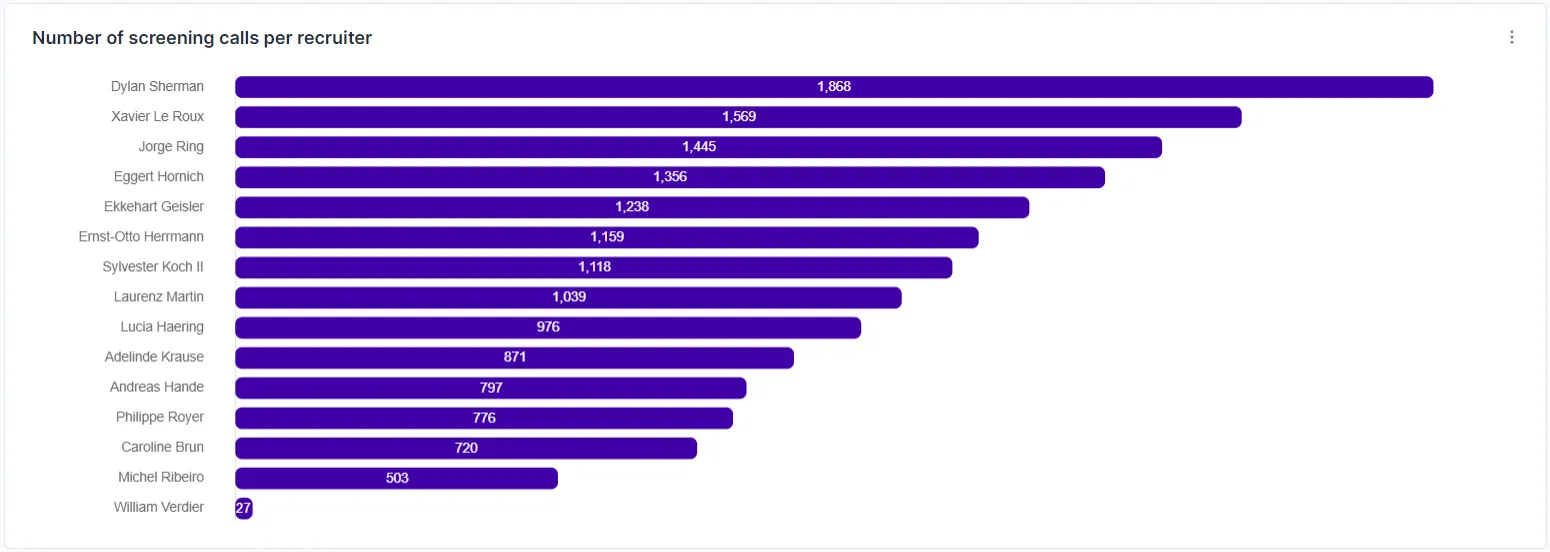
Number of screening calls: Number of the first telephone or video calls for candidates to test their eligibility in a period of time.
Measures the efficiency of the initial recruitment phase and supports the optimization of candidate evaluation.
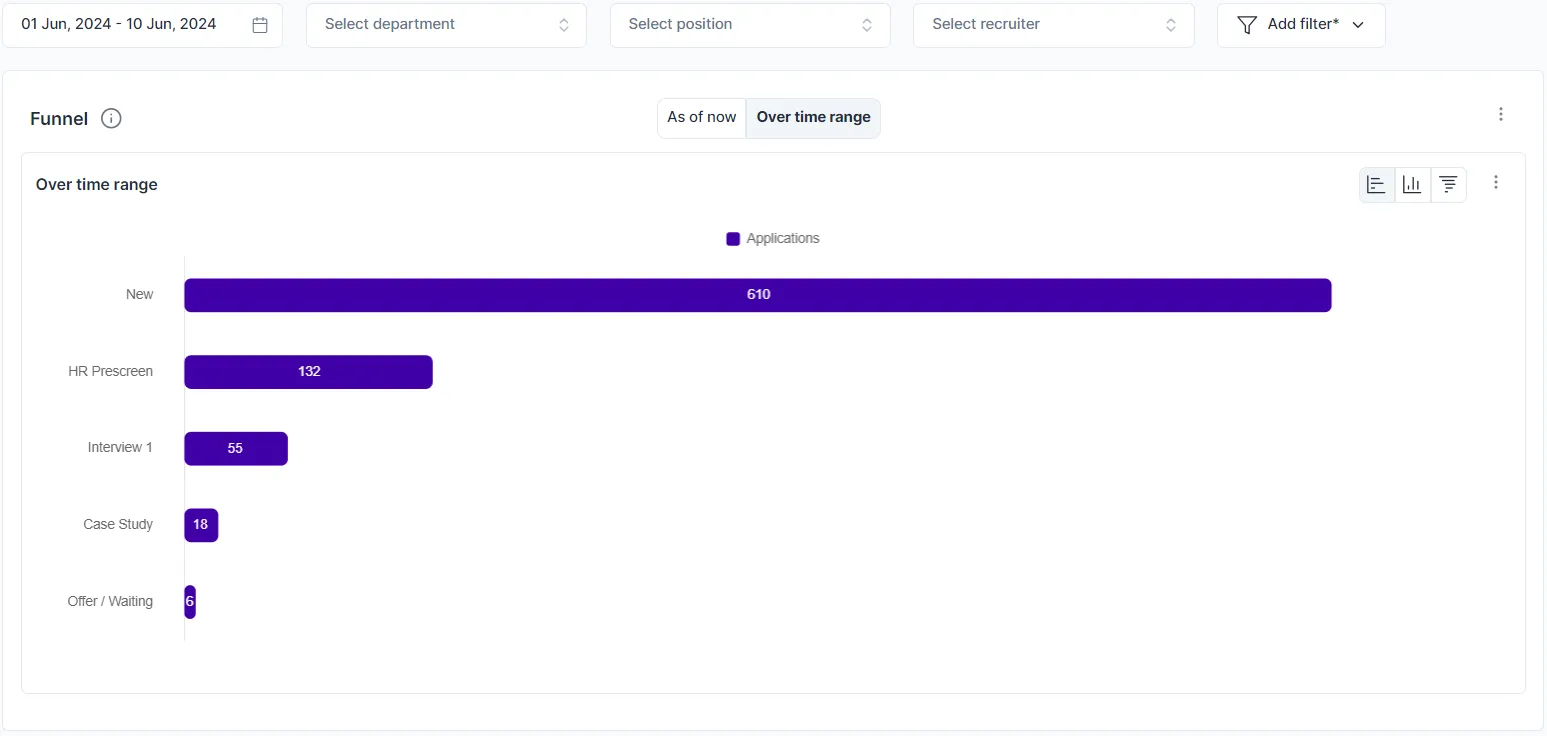
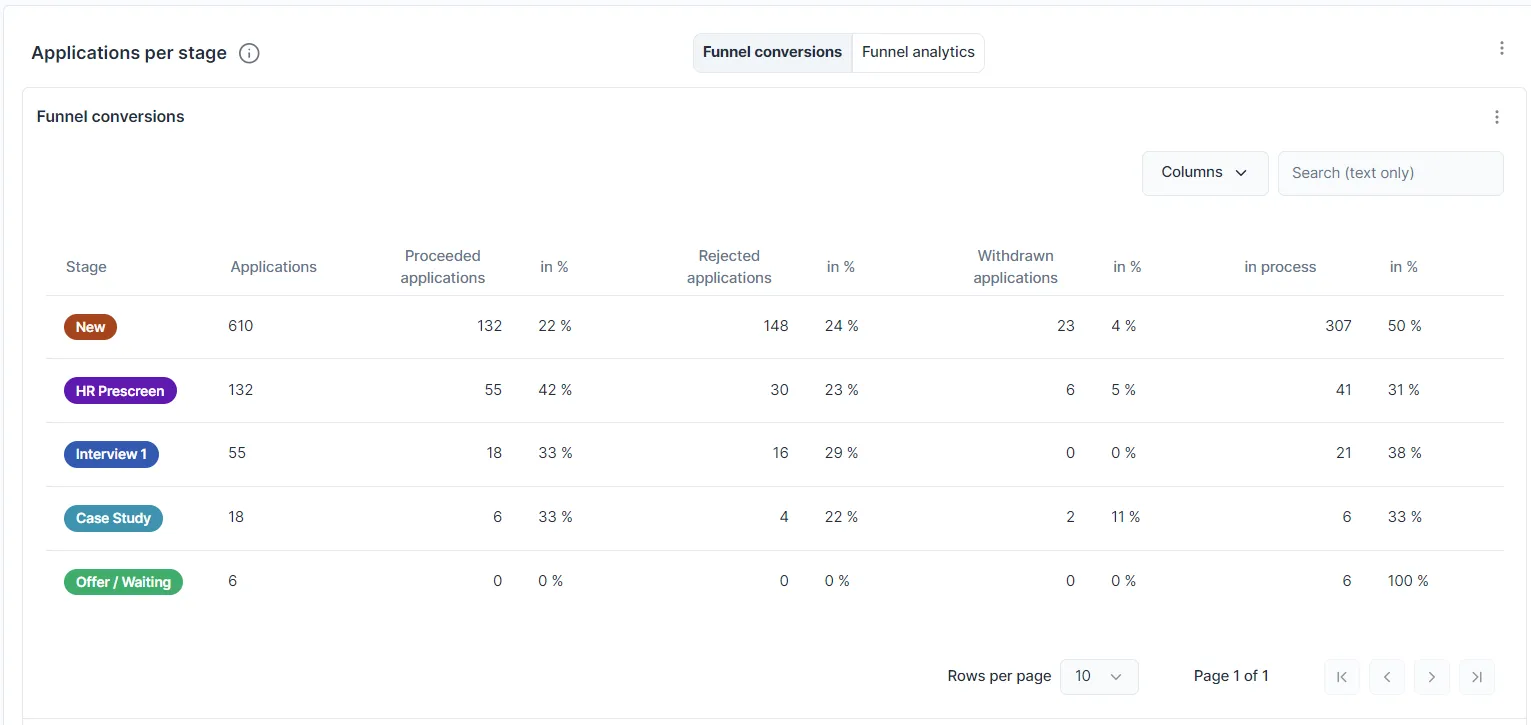
Recruiting funnel: Number of candidates per process phase (e.g. application, screening, interview, offer, hiring) and the conversion rate between phases.
Analyzes trends and weak points in the application process in order to make targeted improvements and increase recruiting success.
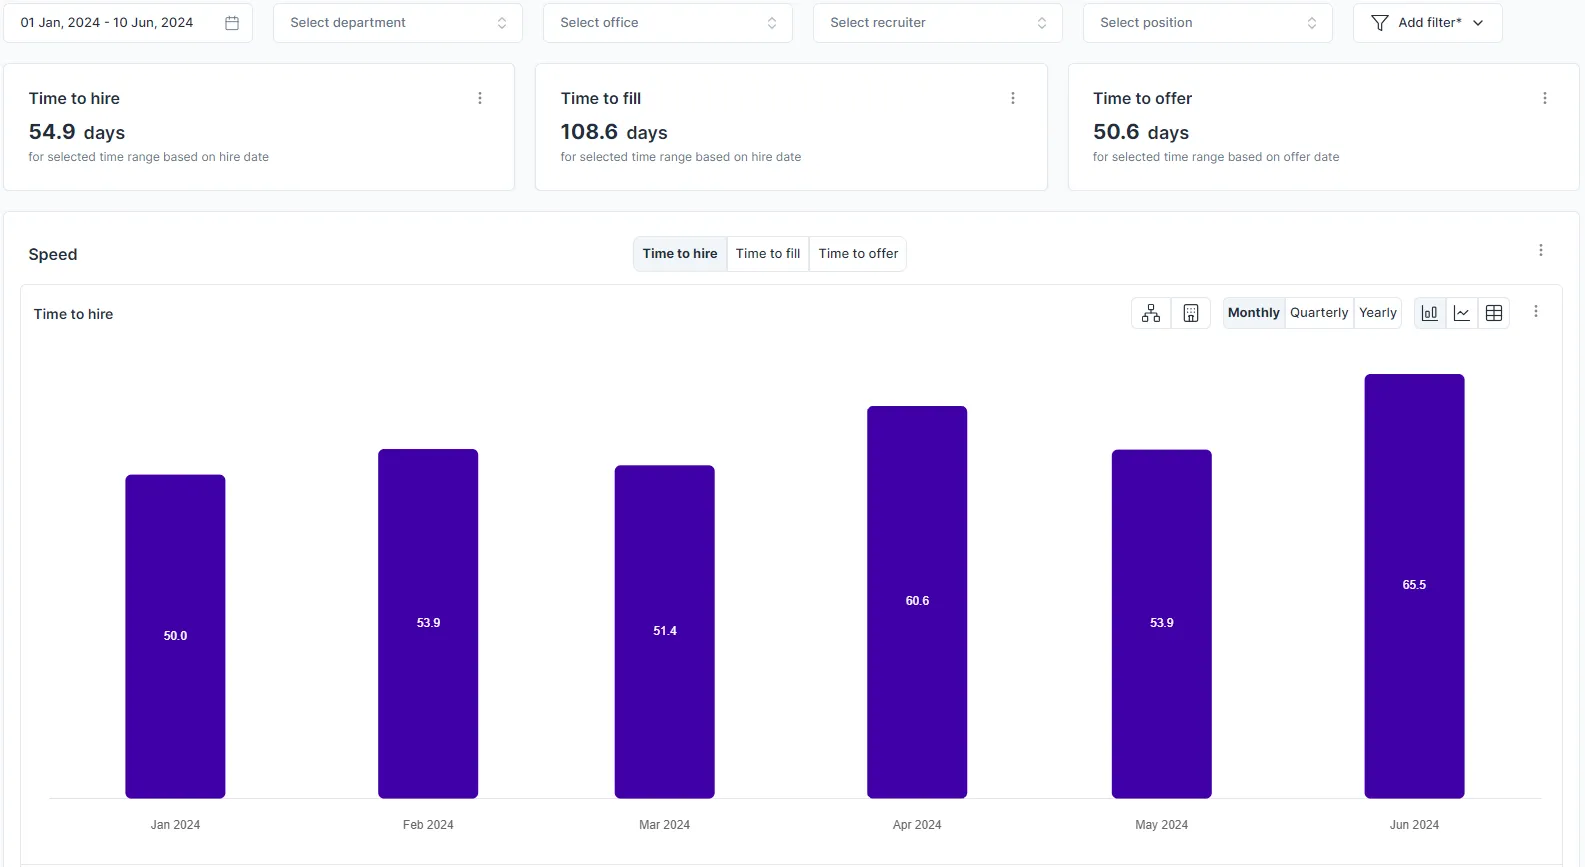
Time to Hire: Average time from job posting to acceptance of the offer.
Evaluates the speed and effectiveness of recruiting, shortened time-to-hire improves candidate experience and prevents loss of talent to competitors.
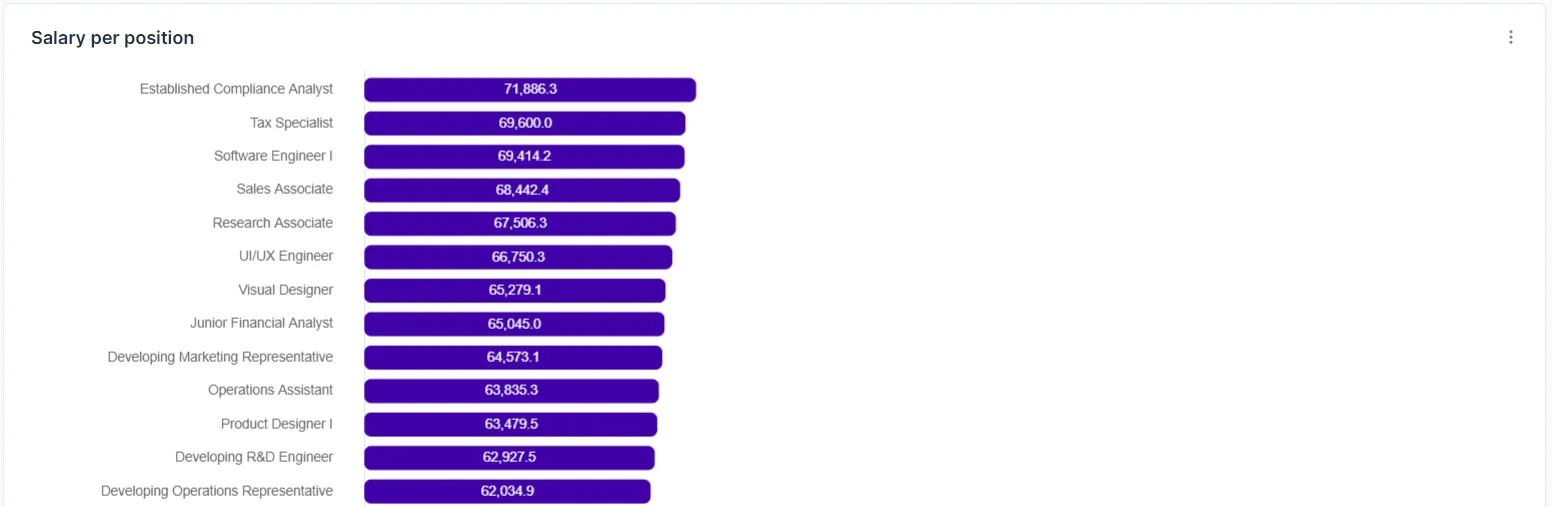
Compensation per position: Average salary for a specific role.
Supports fair and market-oriented pay and budget planning, positively influences talent acquisition and employee retention.
Planned vs. hired jobs: Comparison between planned and actually filled positions over a period of time.
Helps to assess recruiting performance and adjust personnel planning.
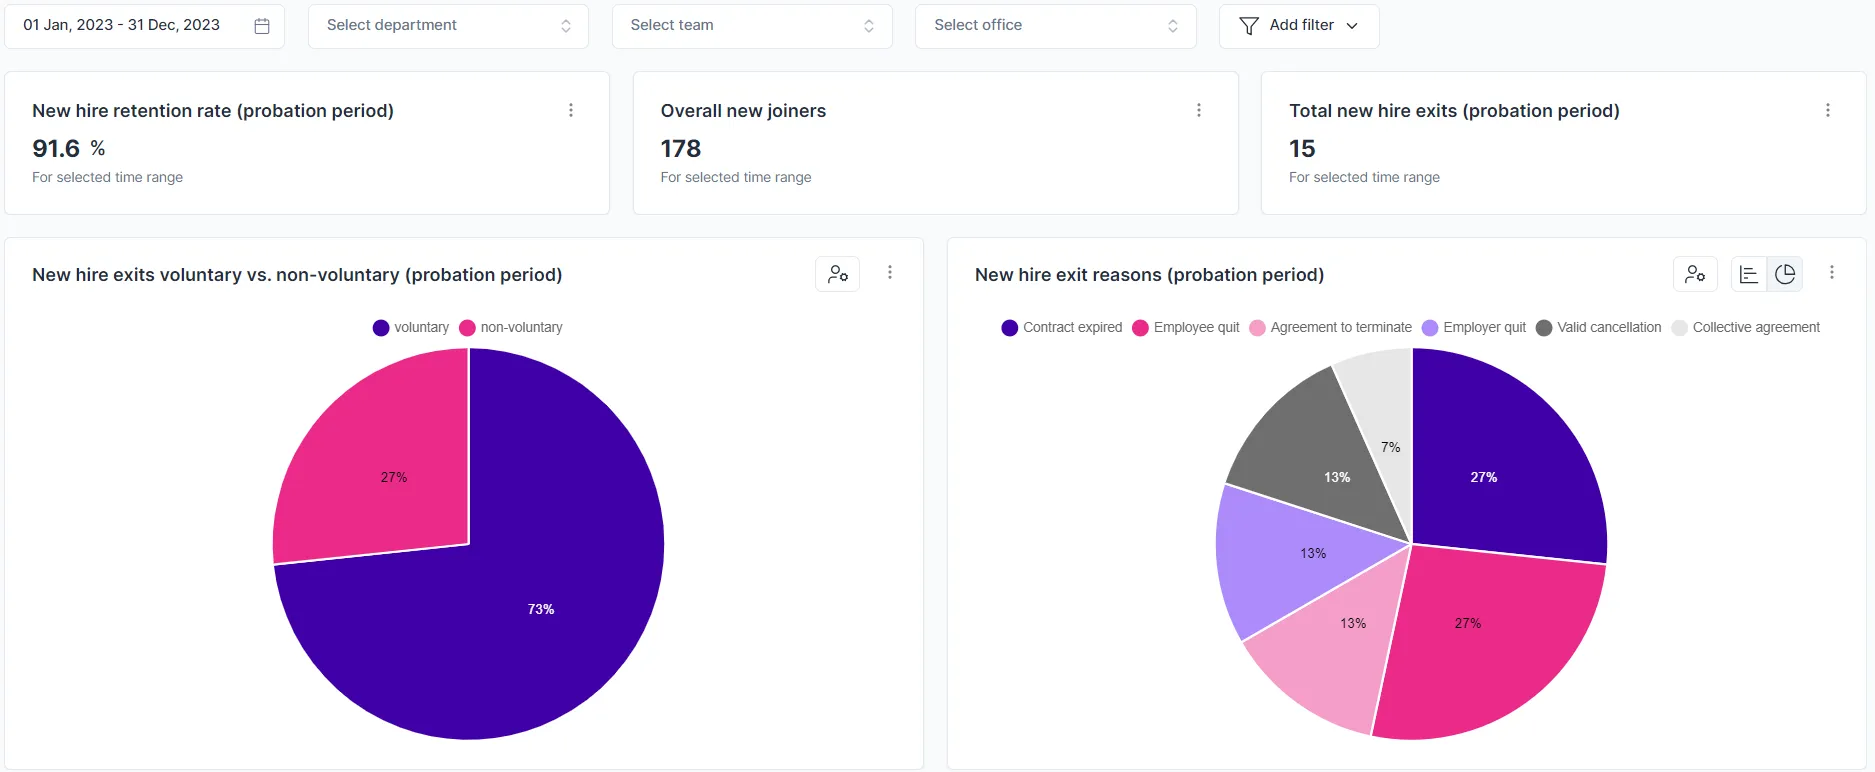
Retention of new employees: Proportion of new employees who remain with the company after defined periods of time (e.g. 30, 60, 90, 180 days, 1 year)
Measures onboarding success and employee satisfaction, high scores reduce recruiting costs and strengthen corporate culture.
People
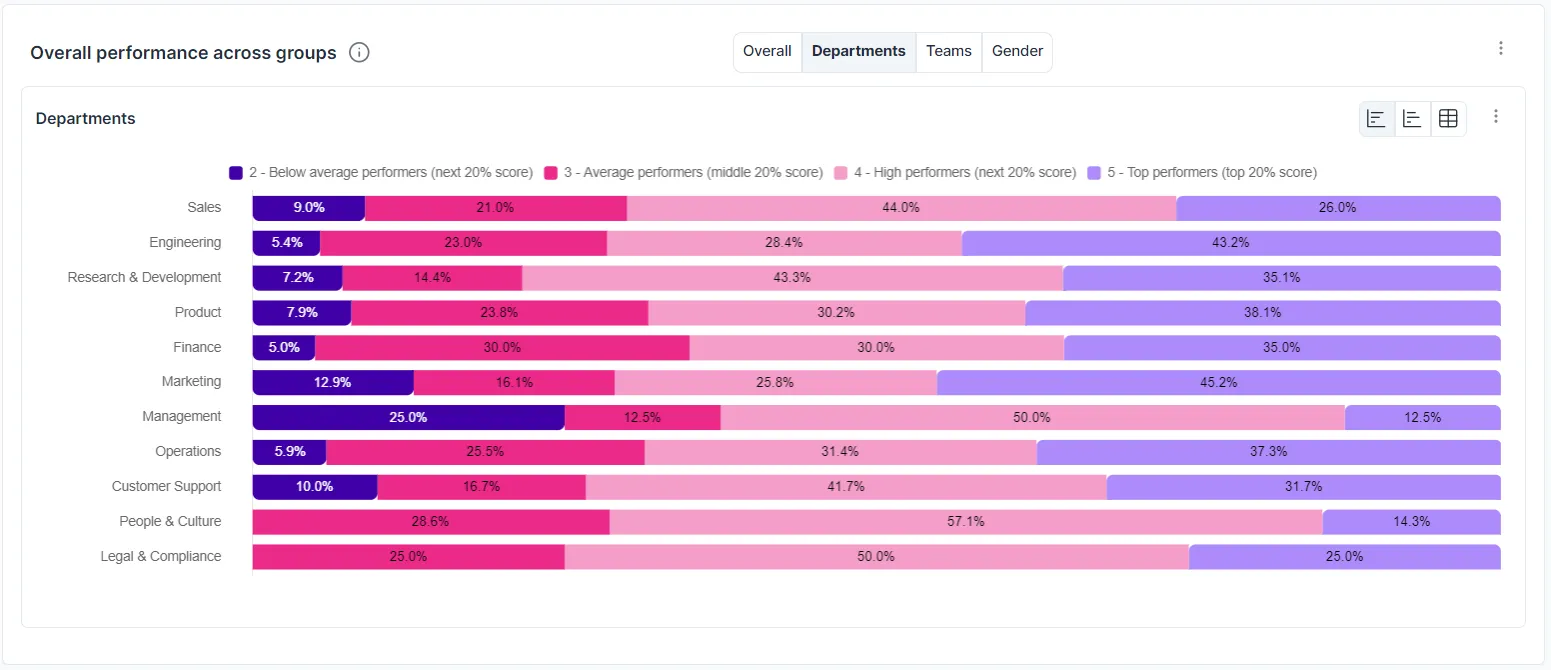
Performance data: Evaluation of the individual and collective performance of various departments using relevant KPIs.
Identifies strengths and weaknesses, supports resource planning and talent development.
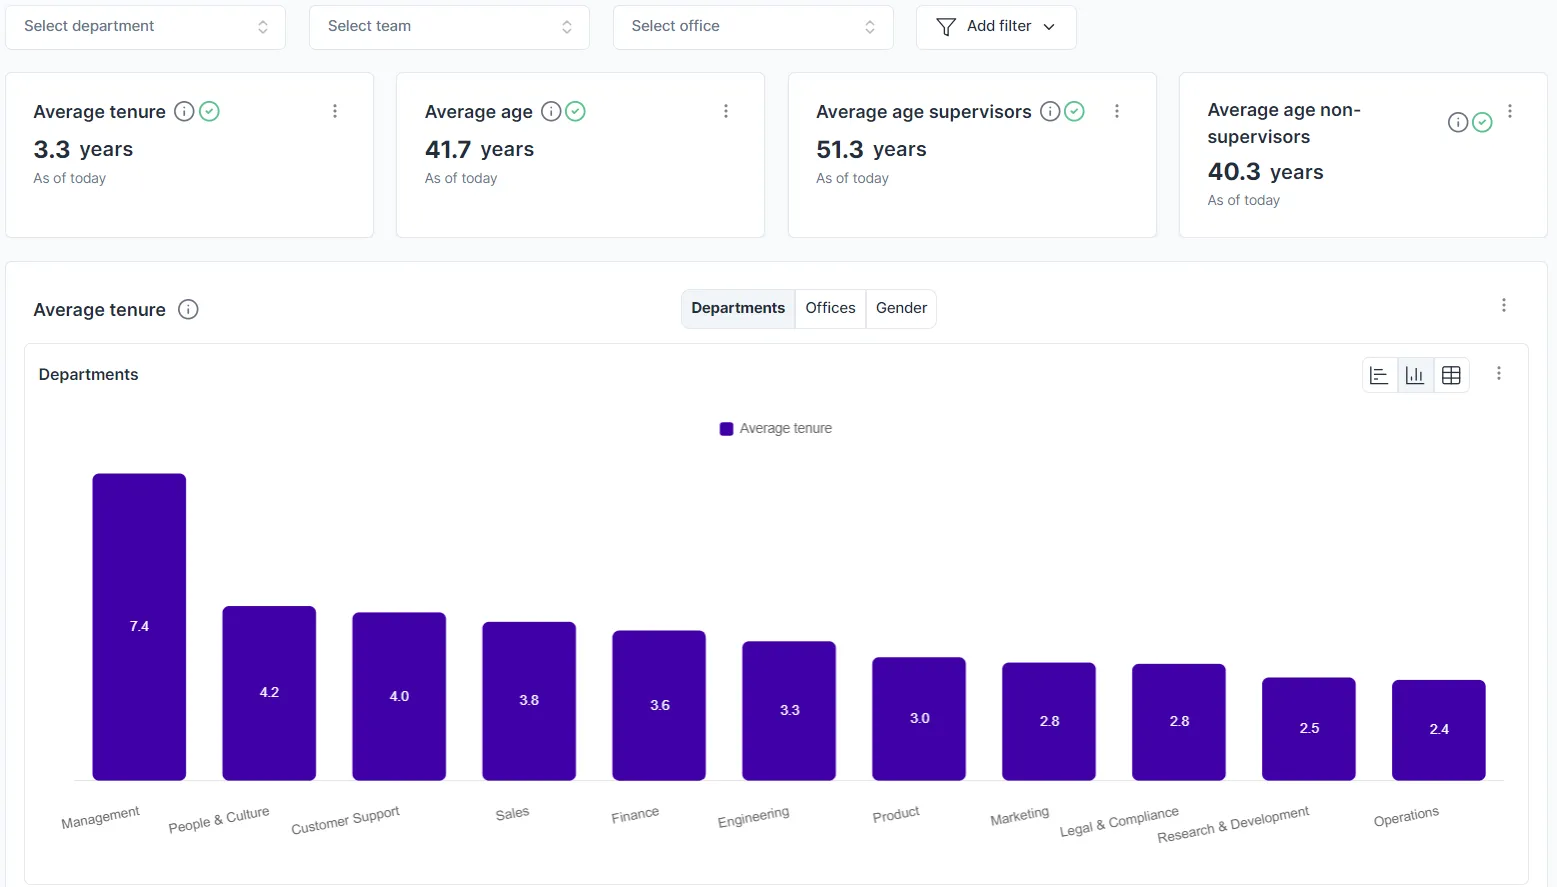
Length of employment: Duration of continuous employment of employees.
Provides insights into turnover, employee retention, and career development opportunities.
Cost per hire: Total costs of filling a position (e.g. advertising, agency fees, referral bonuses, events, travel expenses) divided by the number of hires over a period of time.
Helps to optimize recruiting efficiency and budget use.

What insights does the dashboard provide?
Karen's Recruiting Analytics Dashboard enables teams to make data-based decisions and continuously improve their recruiting processes. Through comprehensive tracking of relevant KPIs, recruiting measures can be optimized, candidate experience improved and ultimately organizational success increased.
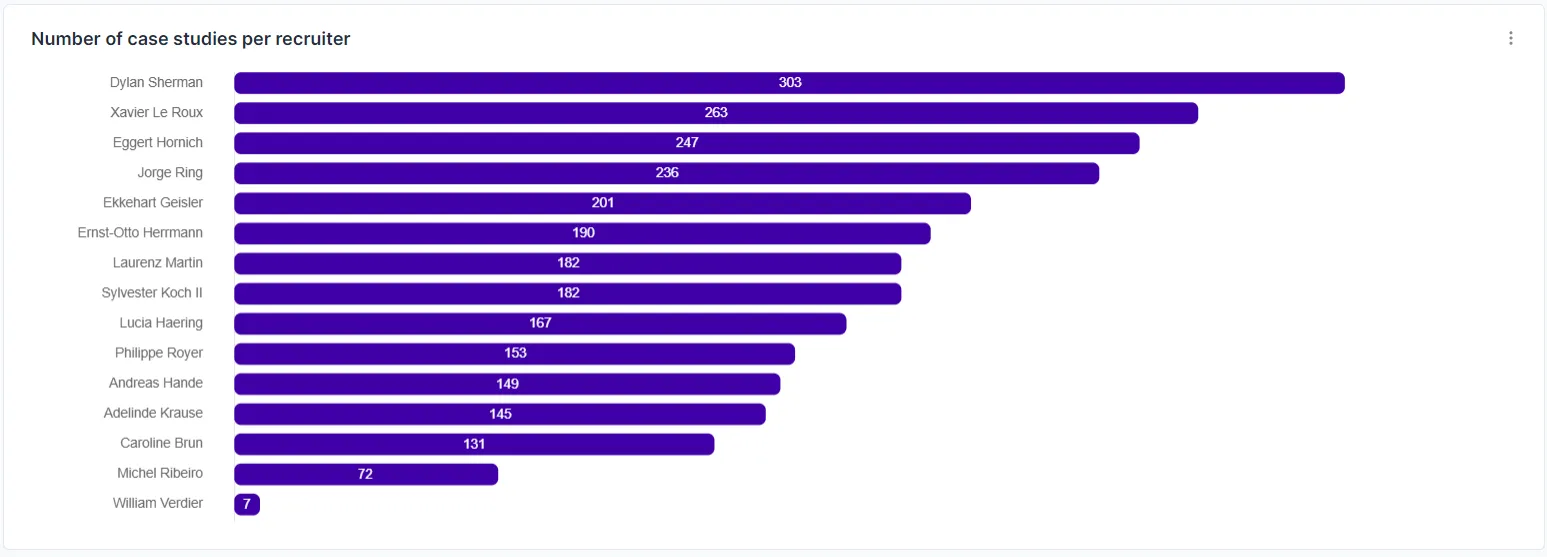
Karen explained, for example, how her SDR team was able to significantly improve the retention rate of new employees through qualitative studies and data analyses: She discovered that important skills of top performers were not adequately tested in the application process, which led to high dropout rates. After adjusting the case study, retention increased significantly, which led to significant cost savings in recruiting.