We are excited to announce our €2.3 Million Pre-seed round led by Earlybird-X! →


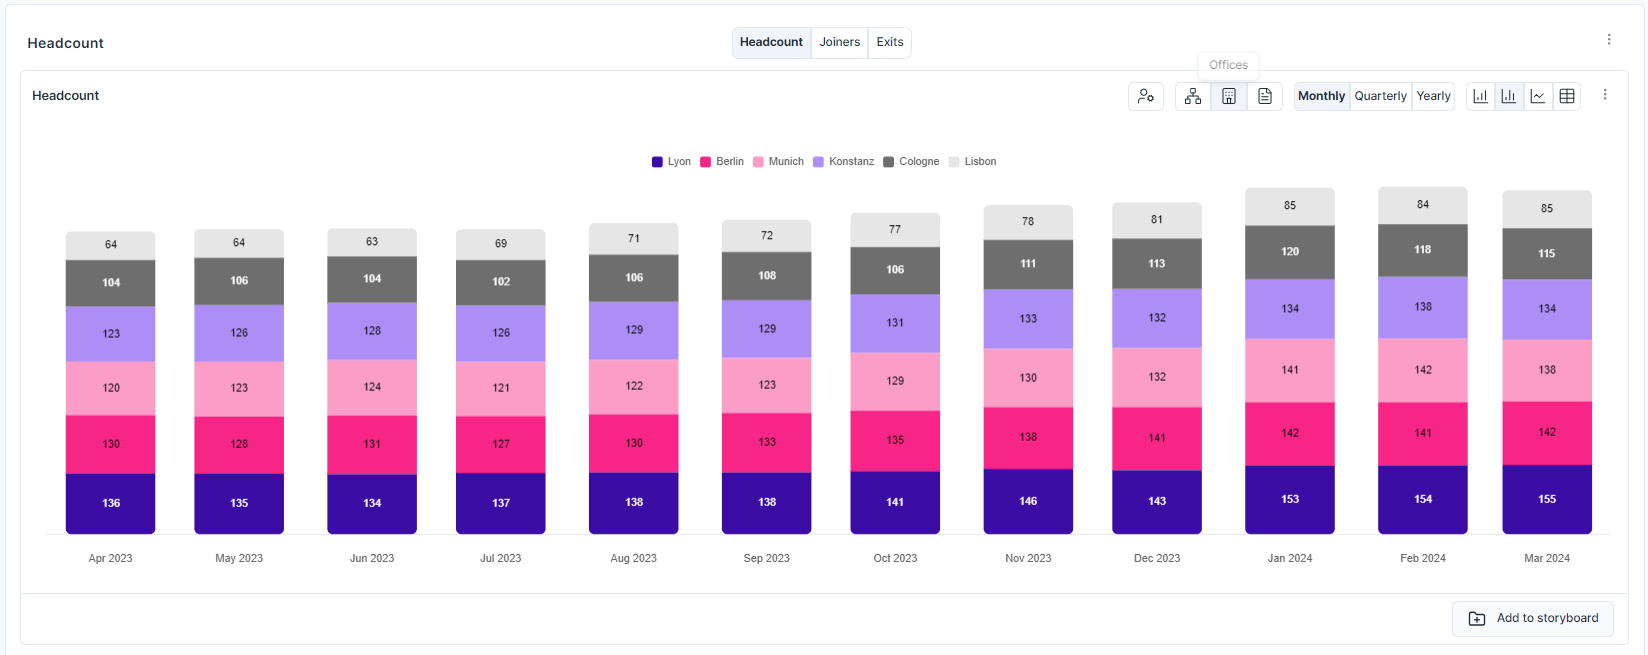
Headcount development over time
By department and region, looking at headcount changes over time including an organization’s new joiners (hires), leavers and internal movements.
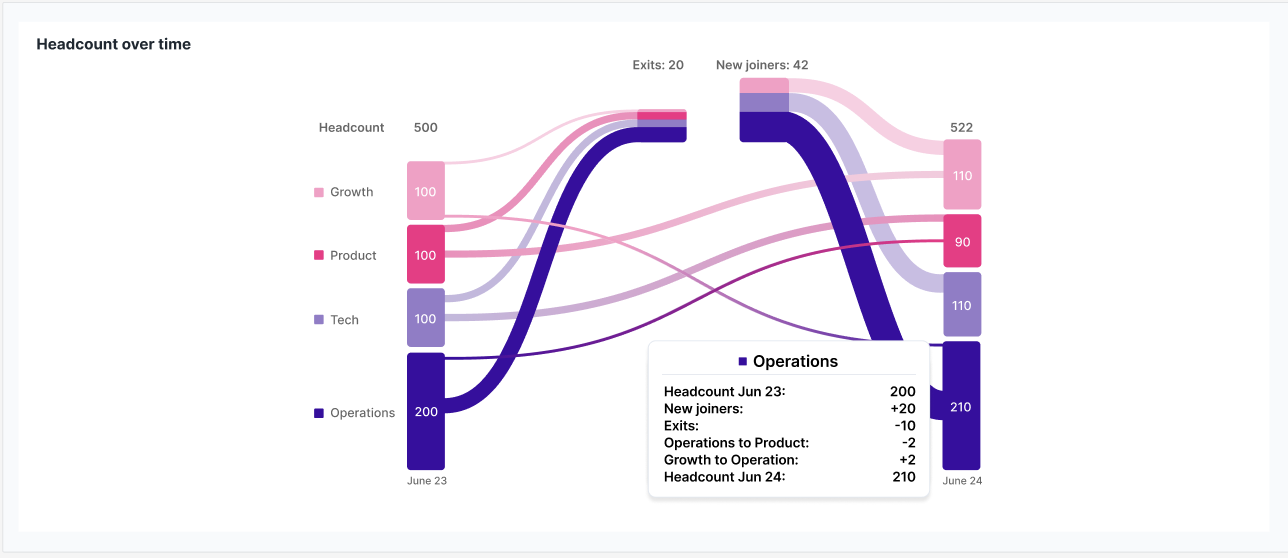
Dummy visualization from peopleIX
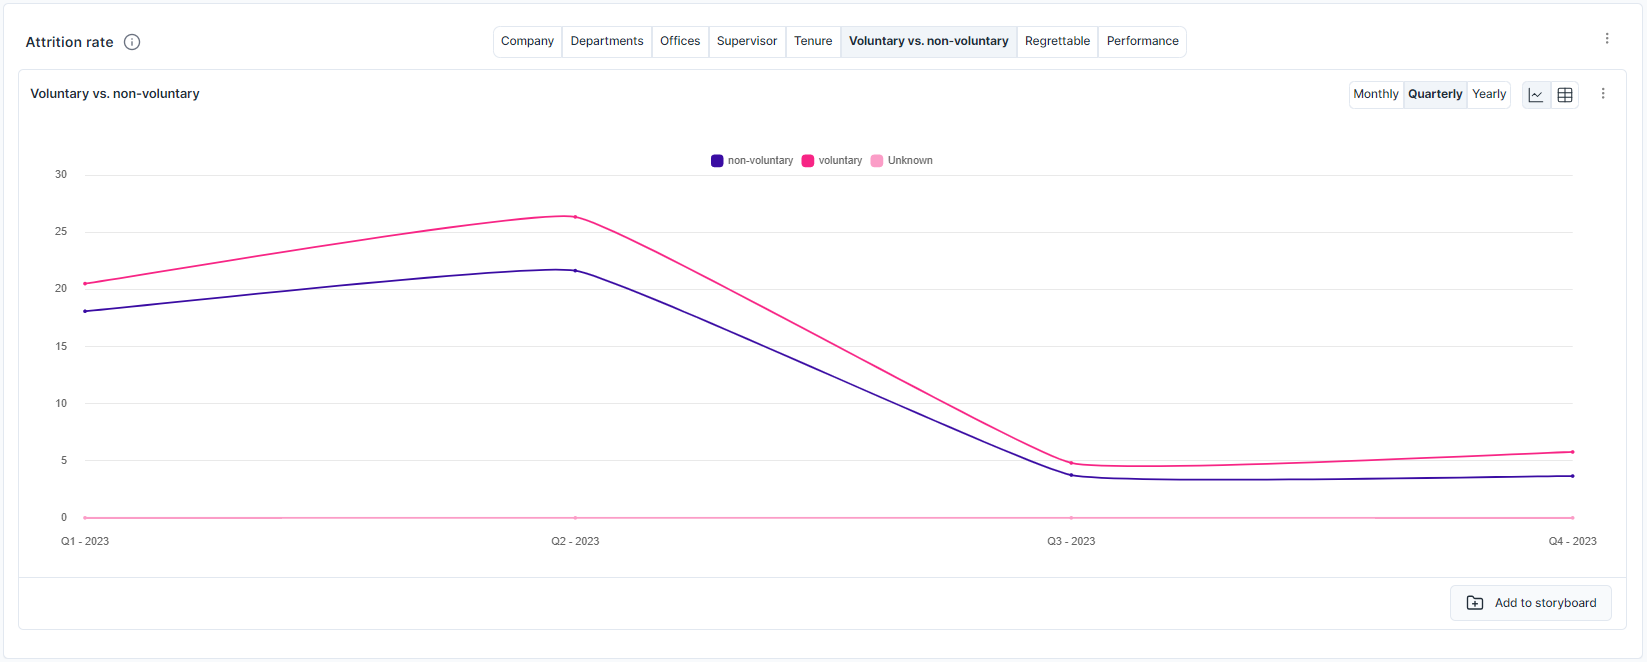
Attrition rate deep dive
Lea suggests building an attrition dashboard around two signals:
1) Measuring voluntary vs. non-voluntary attrition to reveal triggers that may drive employee turnover.
2) Attrition rate across performance groups to identify retention issues with top performers and assess the effectiveness of performance management.
Dummy visualization from peopleIX
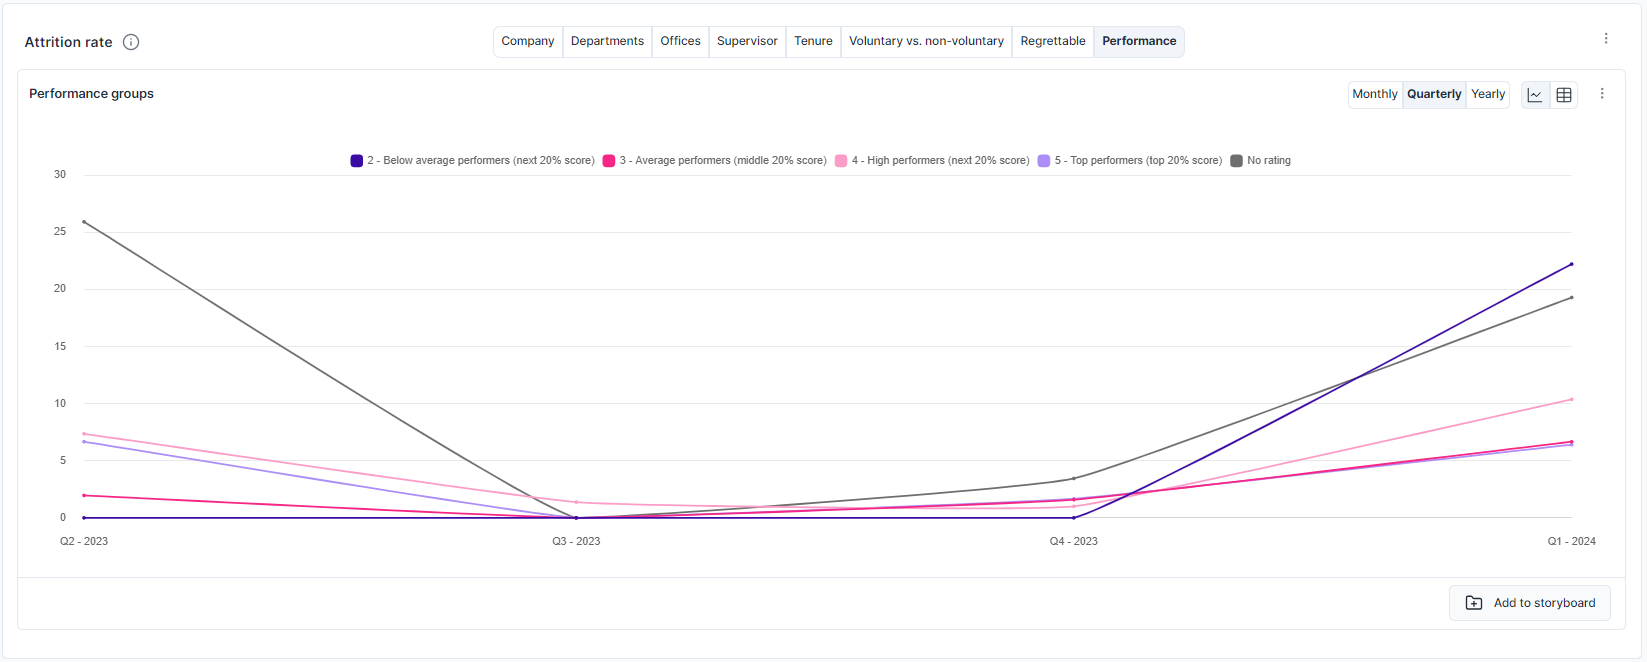
Dummy visualization from peopleIX
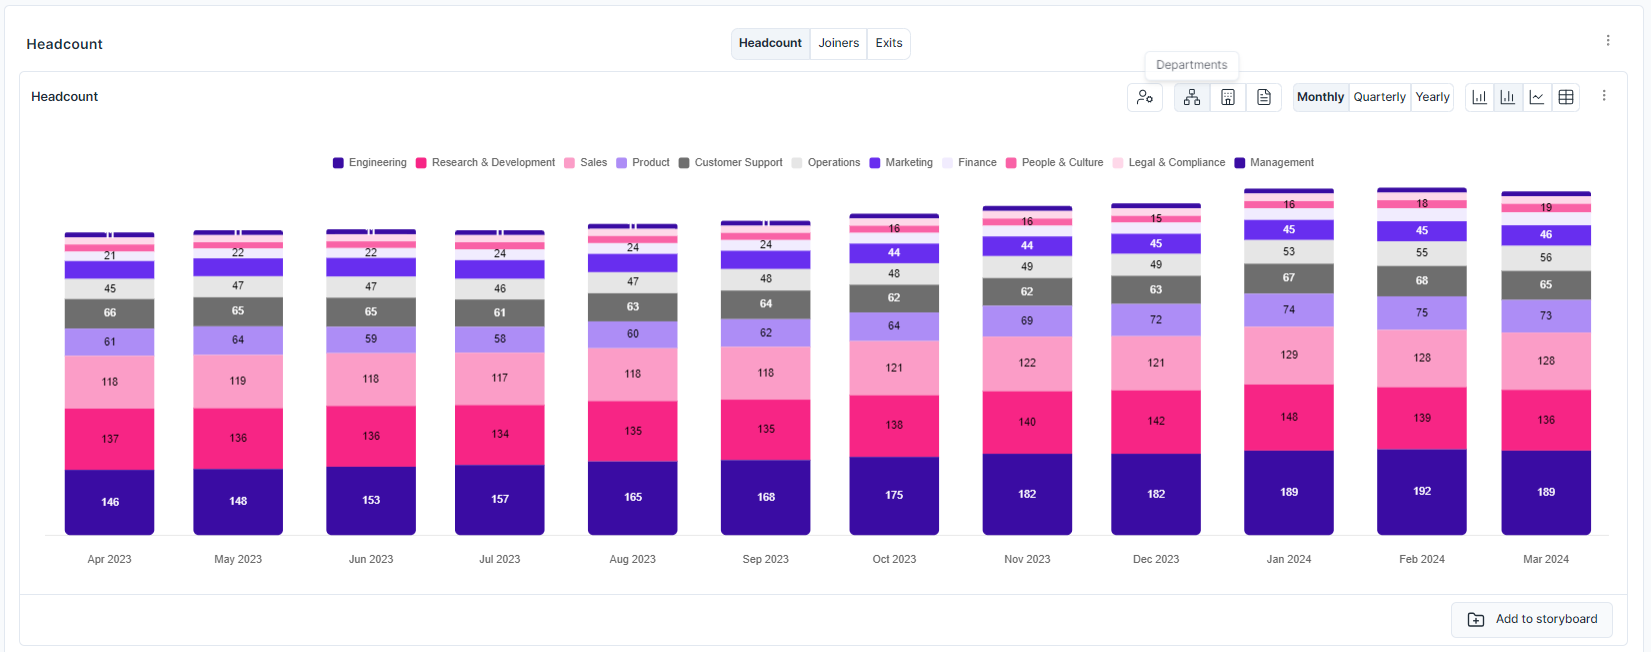
Headcount distribution (locations, layers, departments, divisions)
Keeping an eye on headcount distribution (locations, layers, departments, divisions) is always advisable to enable evidence-based decision-making on strategic elements looking ahead. Data visualization helps to understand how employees are distributed to allocate resources more efficiently and identify workforce imbalances, which strongly impact strategic planning, cost management and HR practices.
Dummy visualization from peopleIX
Dummy visualization from peopleIX
Span of control
A key measure to ensure efficient organizational operations. The span of control gives a company-specific indication of how effectively managers can supervise and support their teams.
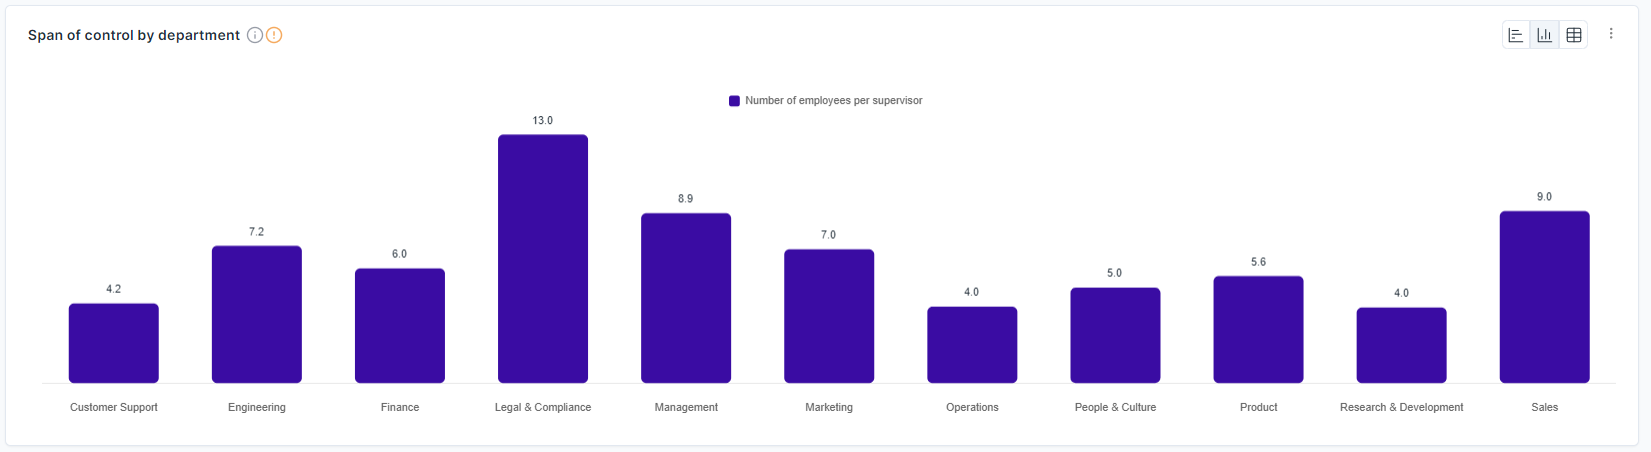
Dummy visualization from peopleIX
Male-to-female ratio and gender pay gap
By understanding diversity, equity and inclusion metrics, Lea recommends monitoring gender diversity within the workforce to assess how inclusive and equitable the organization is and how it impacts employee satisfaction, recruiting performance and retention. It is crucial to identify gender imbalances early to prompt initiatives to address issues proactively.
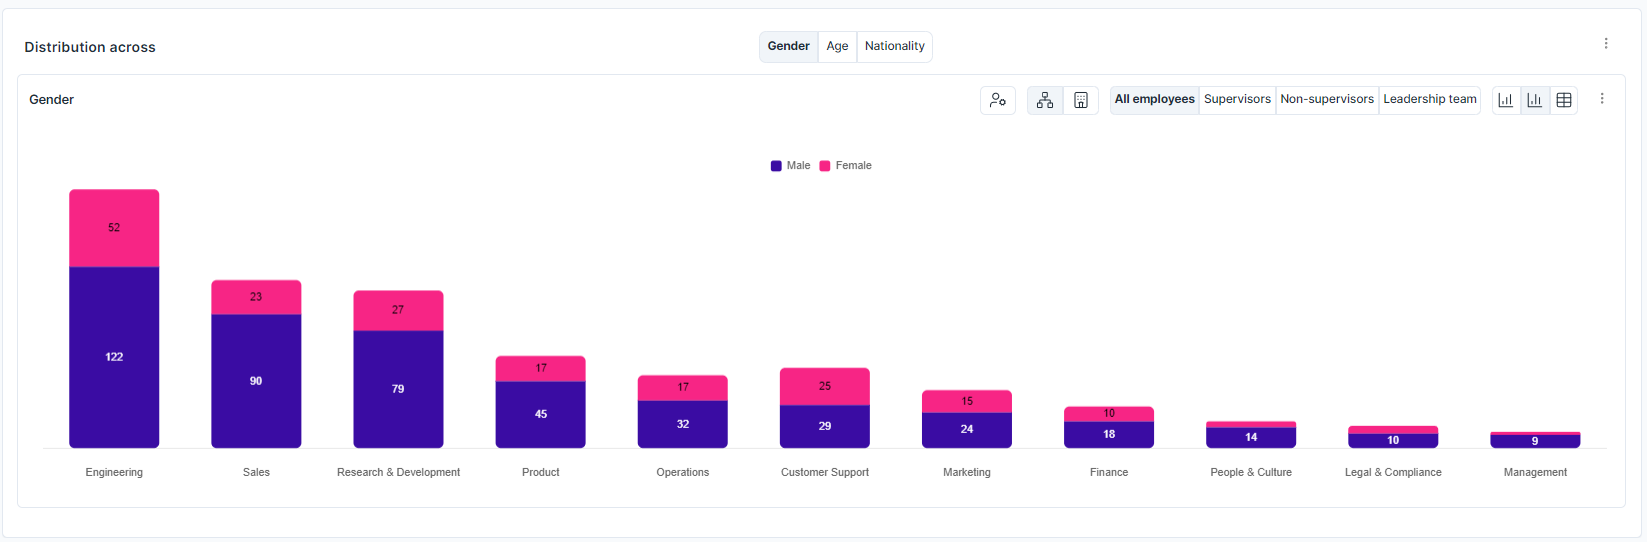
Dummy visualization from peopleIX
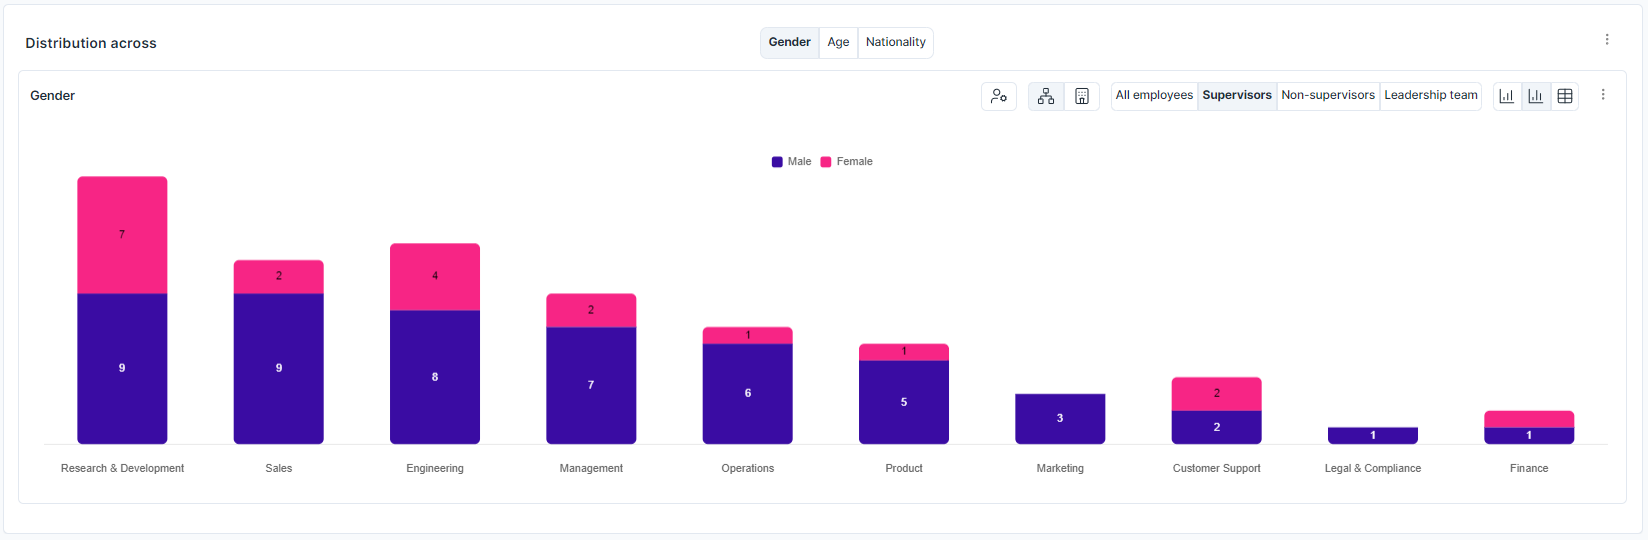
Dummy visualization from peopleIX
Dummy visualization from peopleIX

Made in ![]() with
with ![]()