.webp)
.webp)


About Adra Balissa
During periods of strong growth, recruiting performance and effectiveness is one of Adra's top priorities. In her monthly “Mission Control Center,” she visualizes recruiting data to understand the effectiveness of channels, control hiring speed to achieve headcount goals, and evaluate the impact of investments and recruiting activities on the quantity and quality of candidates. For the organization's long-term success, it also keeps a close eye on diversity, equity and inclusion data in order to promote a diverse and successful organization.
Adra's dashboard provides insights into:
- Measuring the impact of recruiting investments on the quantity, speed, and quality of hiring
- Identifying bottlenecks in the recruiting funnel by analyzing conversion rates in individual steps
- Analyzing the speed of recruiting over time in different departments to manage hiring managers' expectations
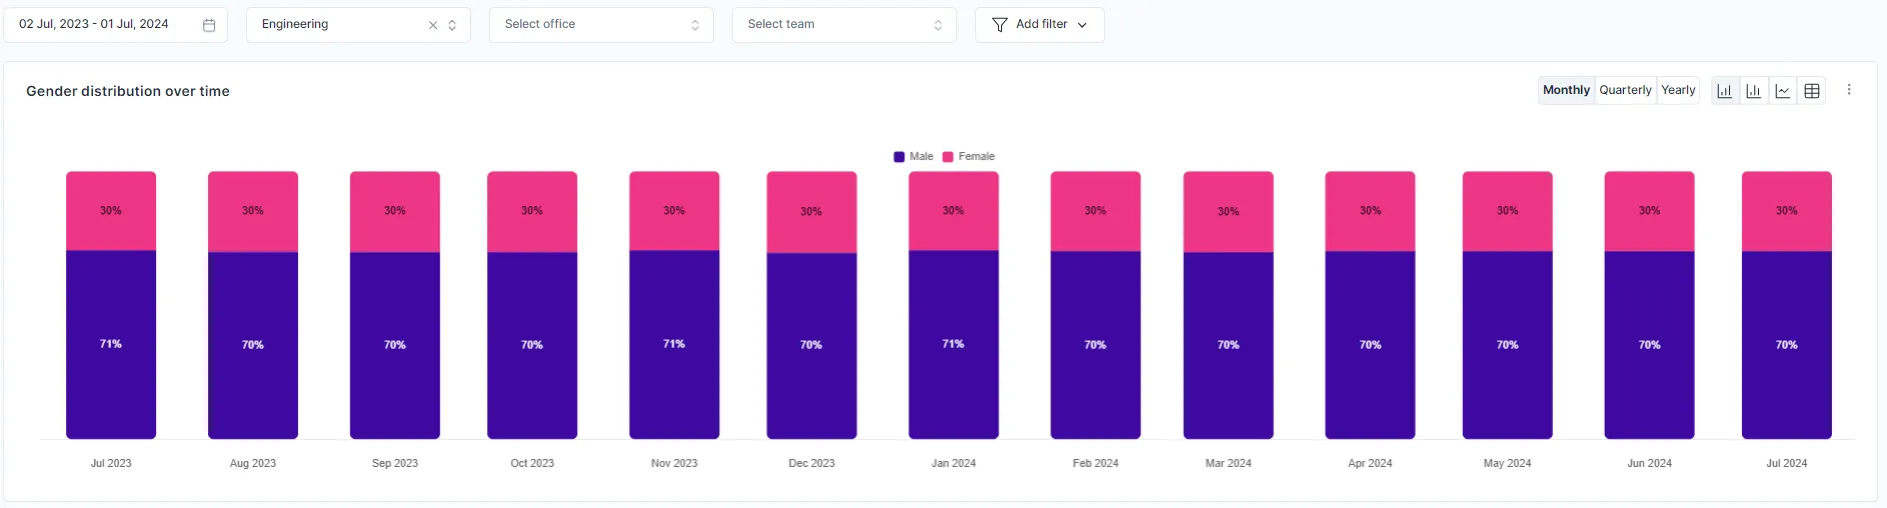
- Identifying gender pay gaps in different departments to improve DEI measures
What does this dashboard include?
Recruiting
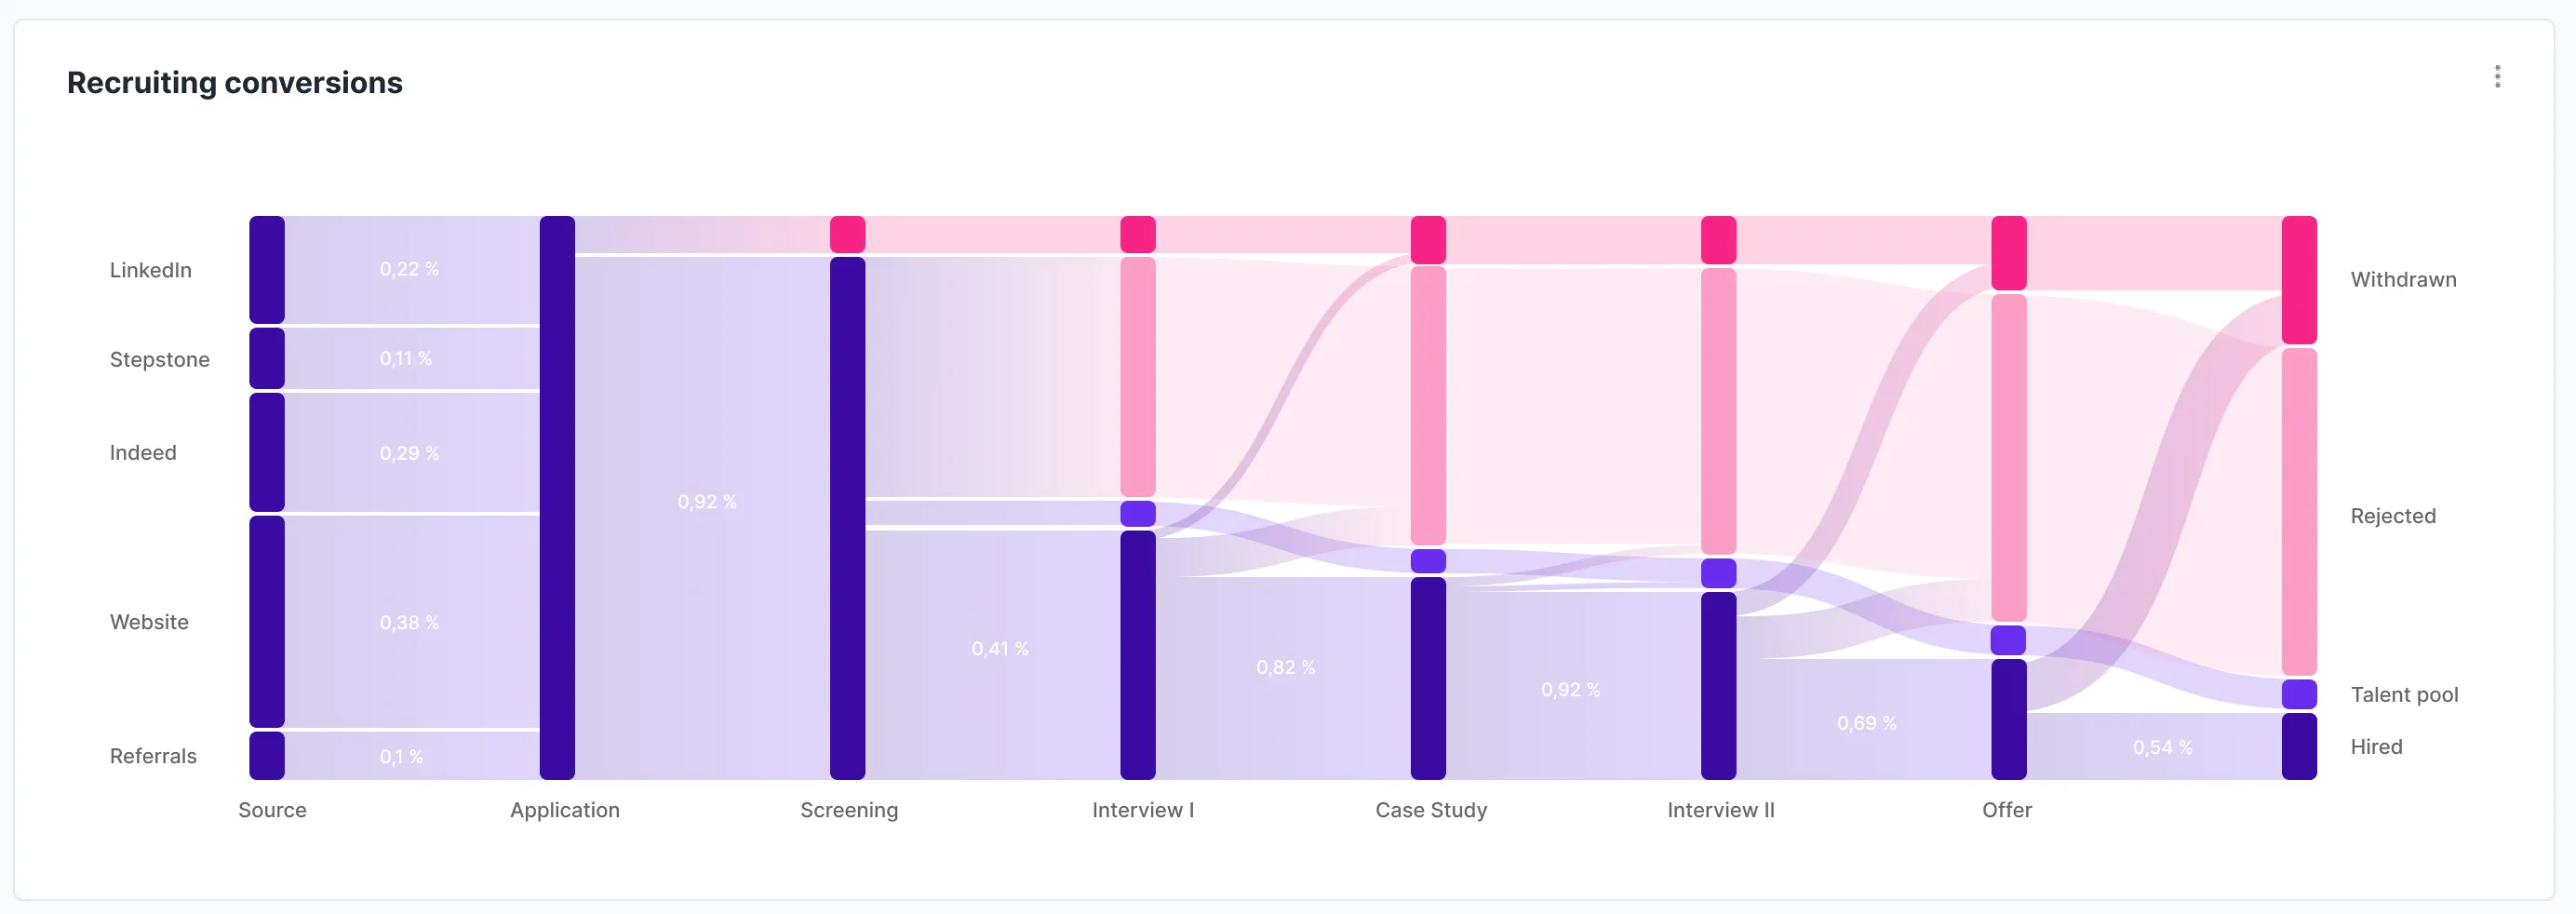
Conversions in the recruiting funnel: Conversion rates show how many candidates move on from one phase in the application process to the next — from the initial receipt of applications to the final hiring decision. Each phase represents a “conversion point.” The measurement helps to identify phases with a high bounce rate, such as when many candidates fail to prepare the offer from the second interview. The analysis of conversion rates is central to a data-driven recruiting strategy, as it uncovers inefficiencies, improves the candidate experience and supports informed hiring decisions.
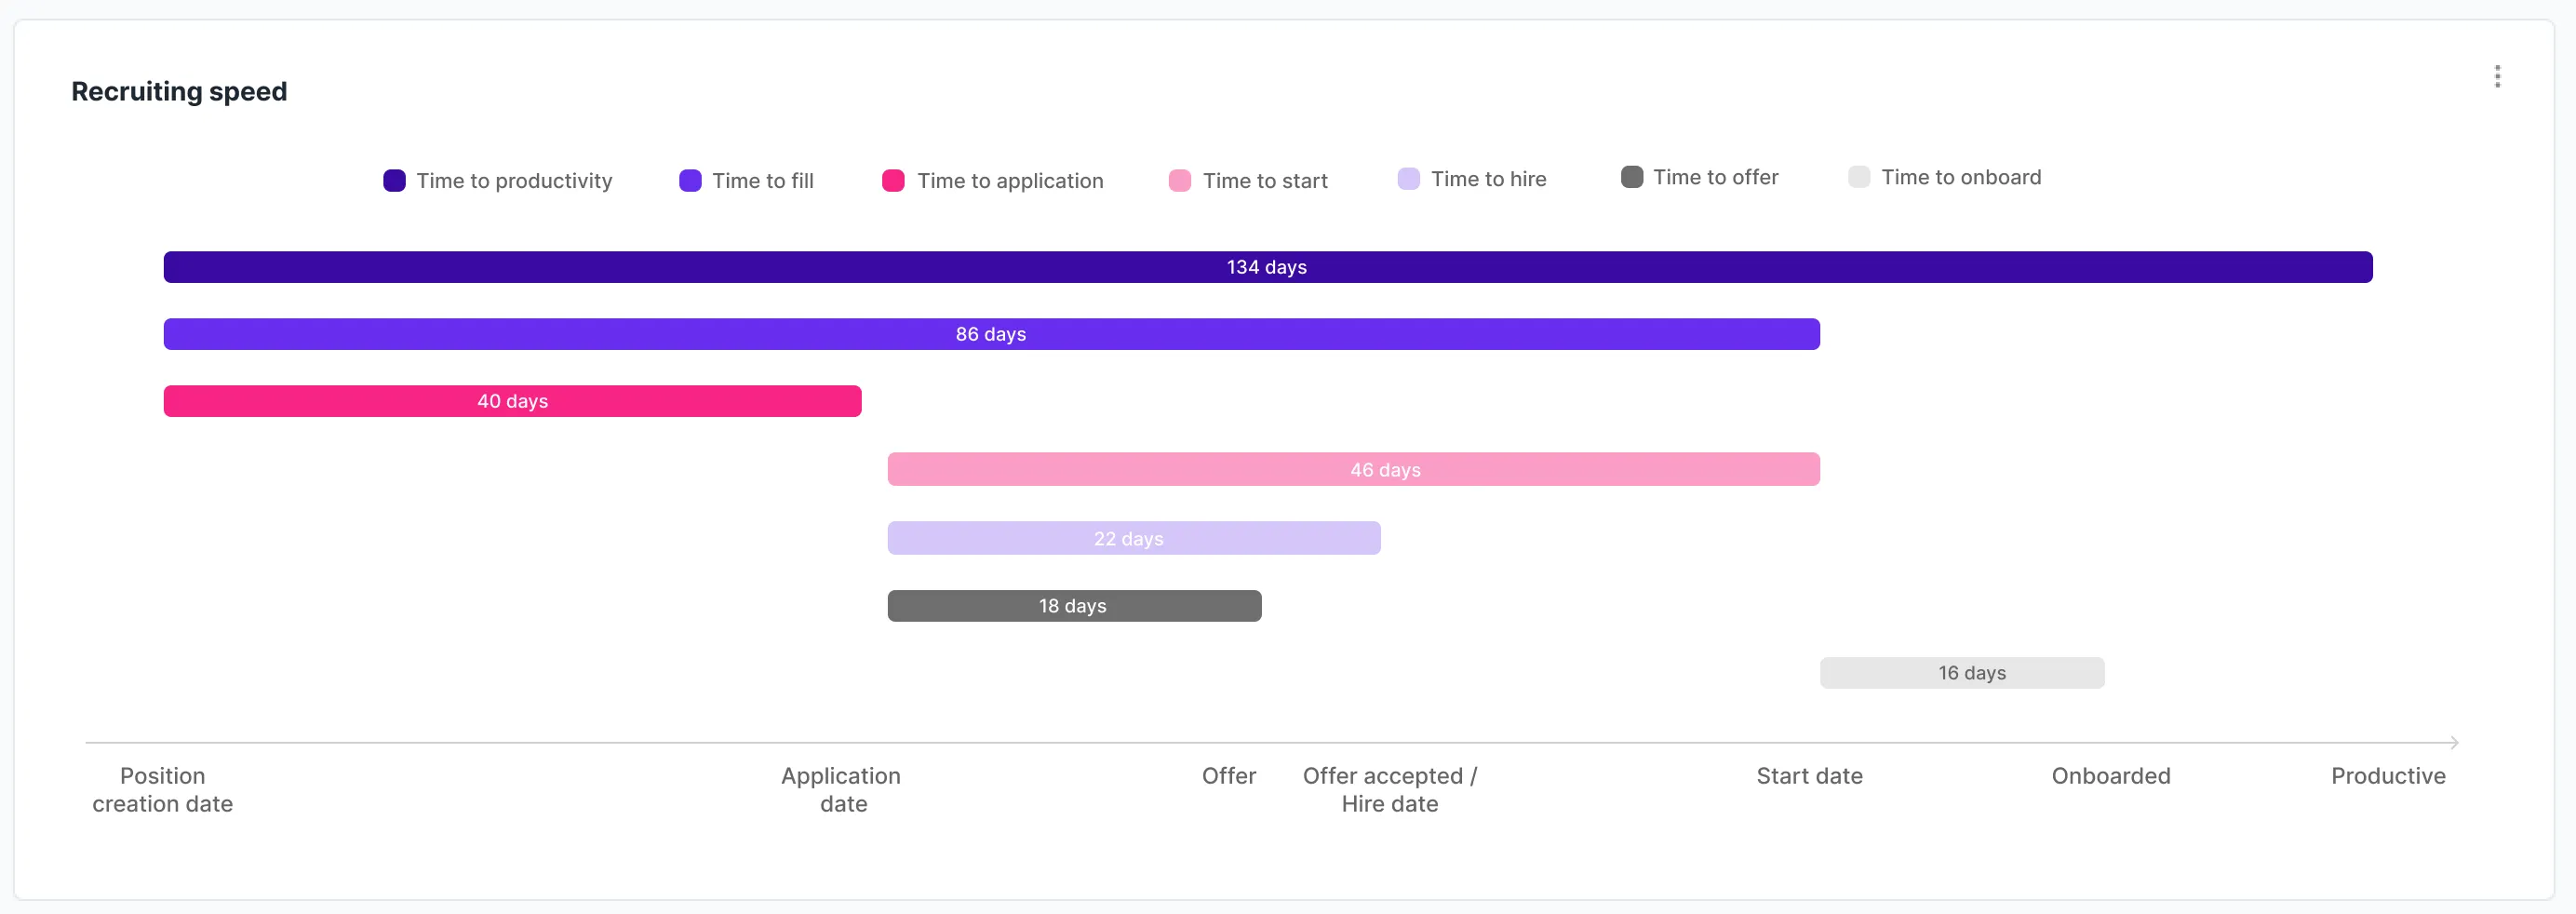
Recruiting speed: Refers to the length of time from the first job posting to when a new hire is fully productive. The “time-to-fill” (days from opening the position to filling) and “time-to-hire” (days from a candidate's entry into the process until the offer is accepted) are often measured. This key figure is important to optimize the recruiting process, improve the candidate experience and realistically manage hiring managers' expectations of the duration of the appointment — essential for reliable personnel planning.

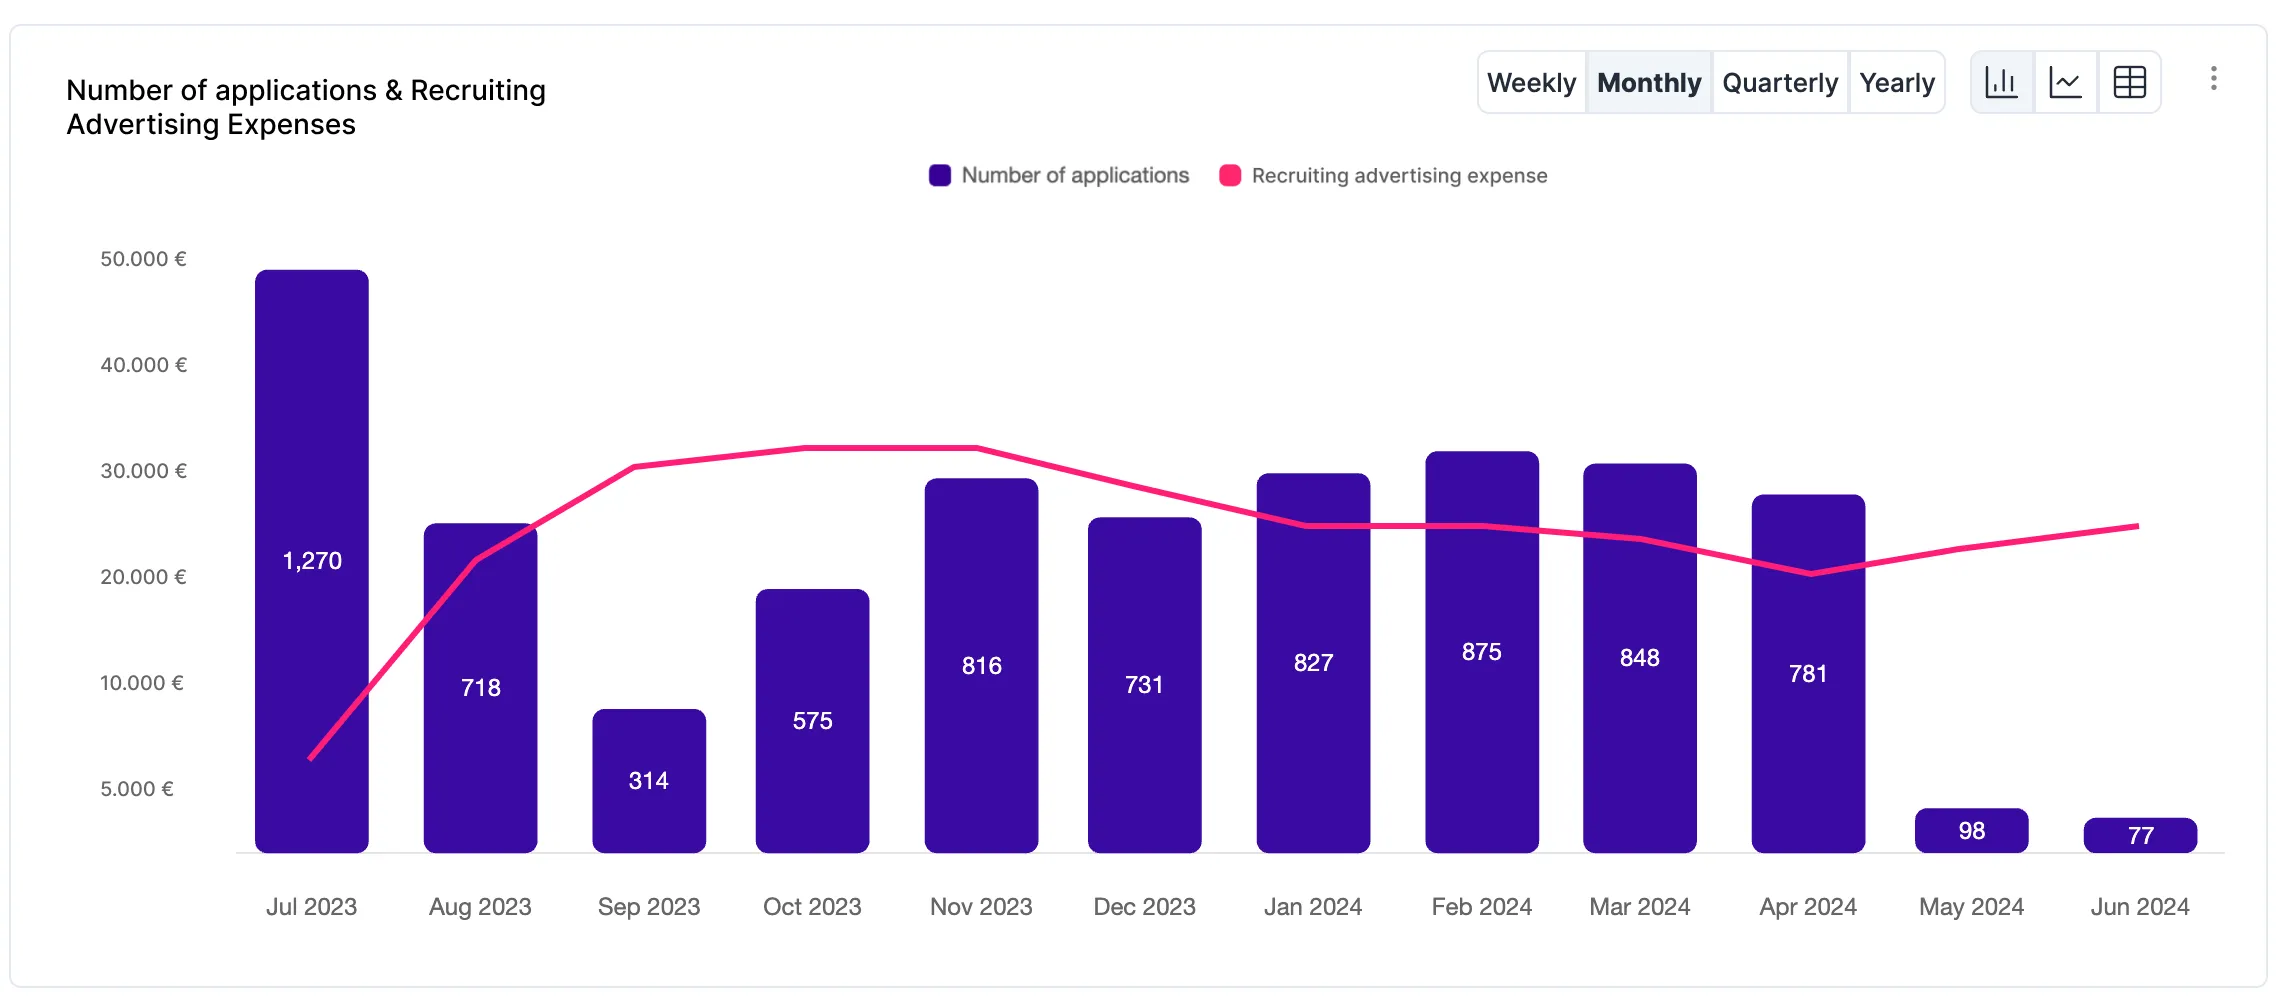
Number of applications: Measures the total number of applications received over a defined period of time. This metric is important for assessing the effectiveness of recruiting measures, the attractiveness of the employer brand, and the health of the talent pipeline. It supports data-based decisions, resource allocation and the optimization of hiring processes.

Diversity, Equity & Inclusion
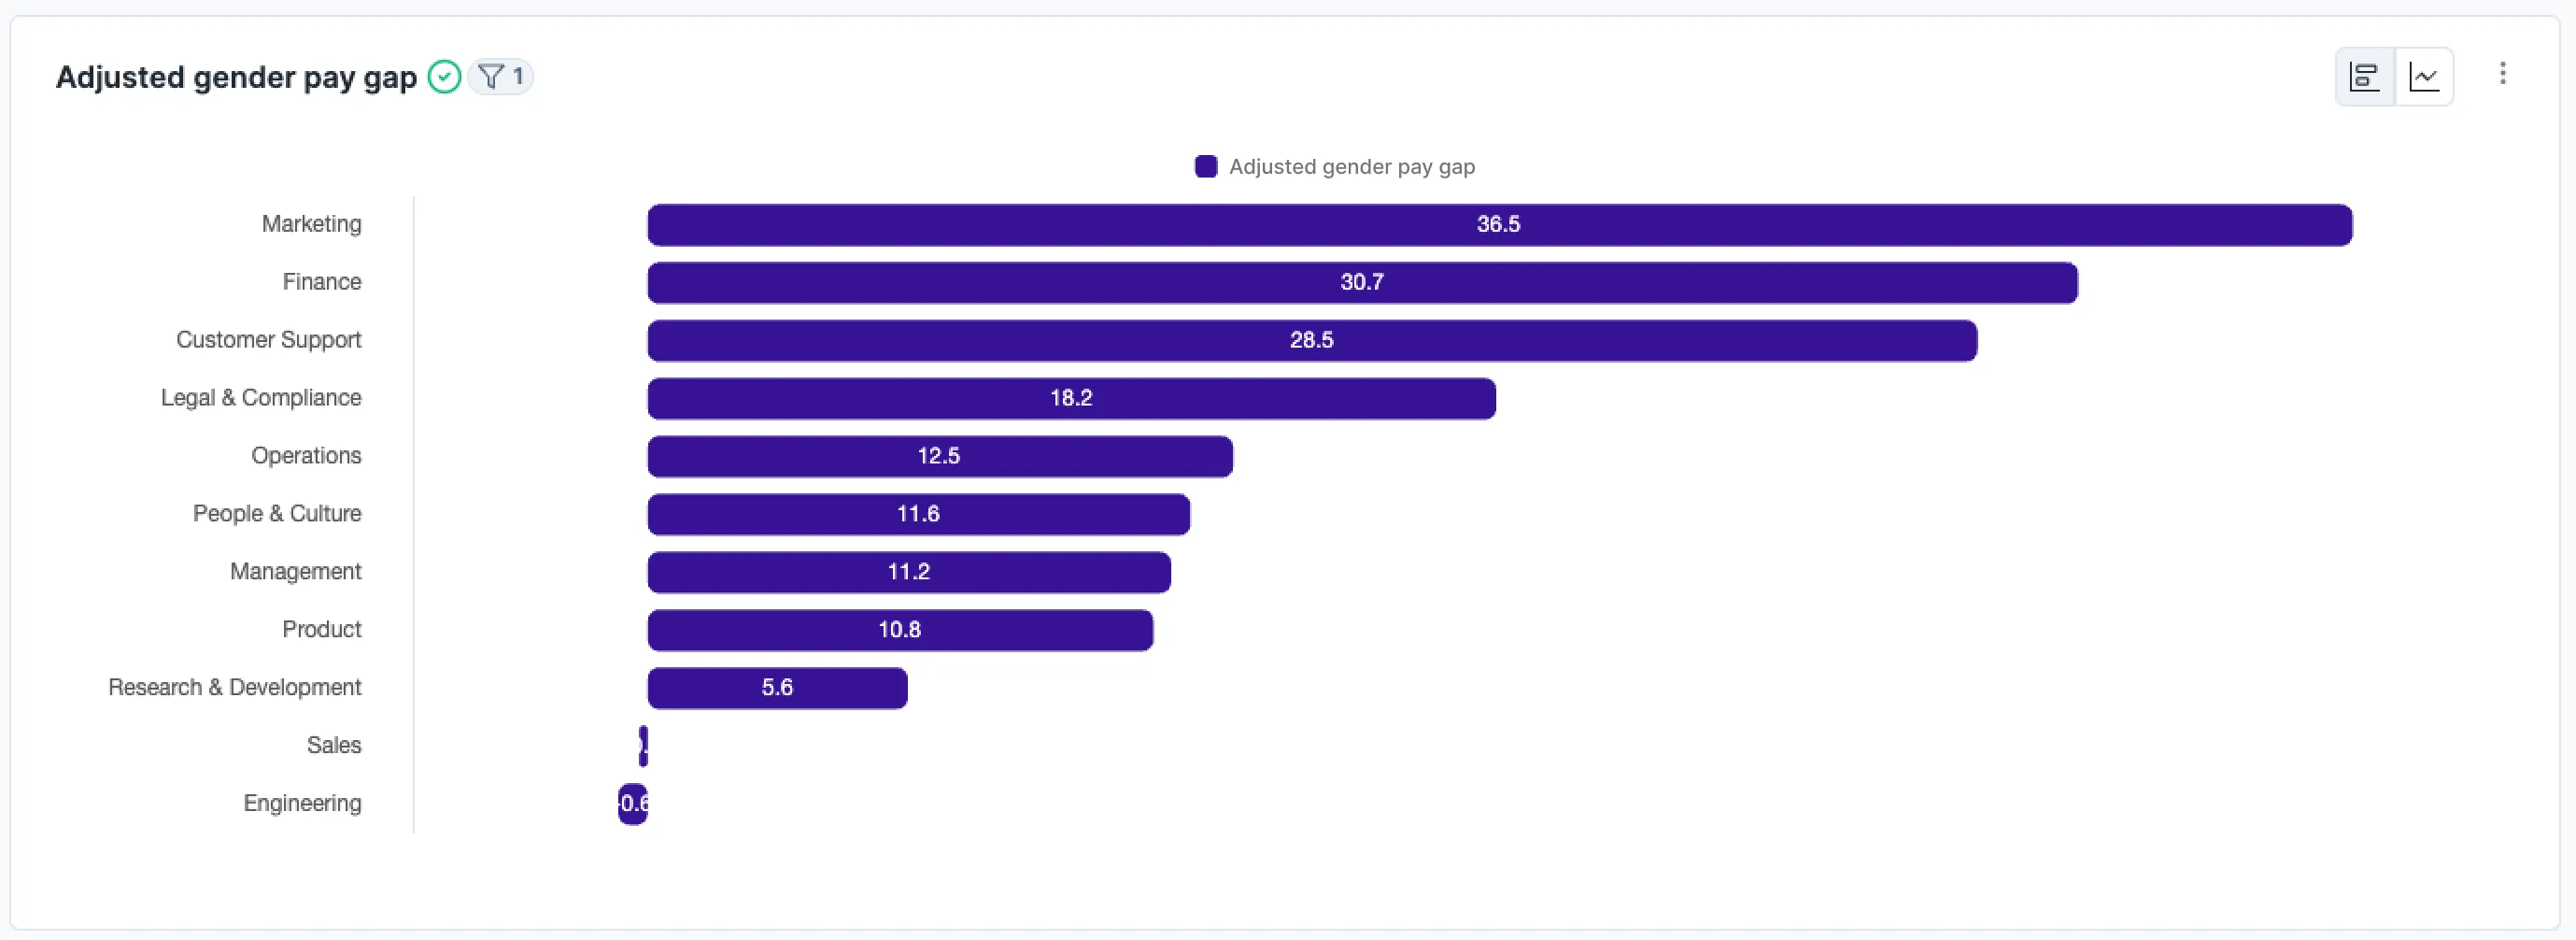
Adjusted gender pay gap: Measures the difference in pay between the sexes, adjusted for factors such as job role, experience, and other objective variables. The aim is to isolate that part of the salary differentials that cannot be explained by these factors and thus shows potential discrimination or bias. Measurement is important to uncover hidden pay discrepancies and promote fair compensation practices. It strengthens employee trust and commitment, attracts diverse talent, ensures compliance with legal requirements and contributes to an inclusive and efficient organization.
What insights does this dashboard provide?
Adra's Recruiting & DEI dashboard allows her and her team to identify trends and patterns and derive insights from them. By bundling all data in a central Mission Control Center, she can act proactively — for example, reallocate recruiting resources to ensure headcount goals for the current year.