Not Just Another Exit: Uncovering the Real Story Behind Attrition
In this report, we dive deep into how employee attrition has evolved — revealing hidden patterns across age groups, genders, contract types, job families, and seasonal shifts throughout 2023 and 2024.
Introduction
In this report, we took a deep dive into attrition trends across a workforce of around 4,500 employees over two years (2023–2024). We identified clear patterns in turnover by age, gender, seniority, and role.
The key takeaways? Attrition rates remain high among younger employees, voluntary exits account for the majority of all exits and there are distinct seasonal trends in both years.
This analysis aims to answer critical questions:
How do attrition rates vary by age group and gender?
Which job families are most affected?
What seasonal patterns emerge?
What insights can businesses derive to support retention and workforce stability?
Key findings include:
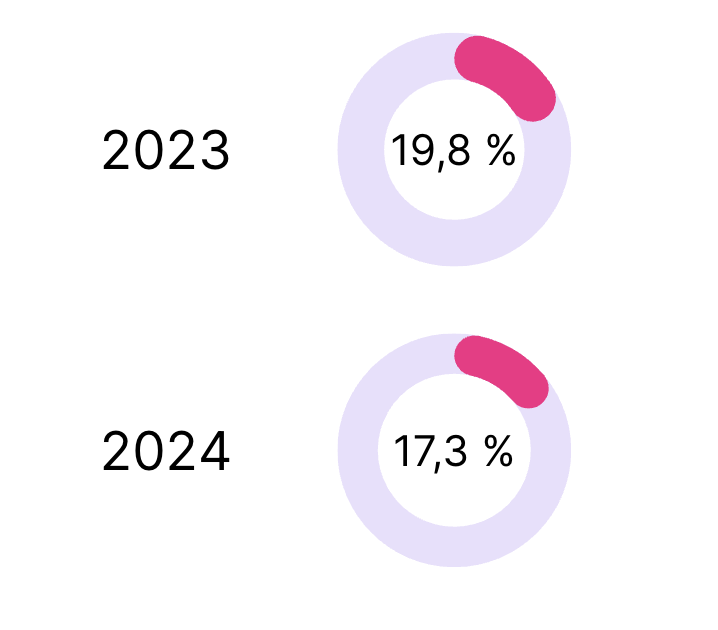
A slight decrease in the attrition rate from 19.8% in 2023 to 17.3% in 2024.
Clear patterns in attrition across different job families, with some roles experiencing higher rates.
Seasonal fluctuations, with higher attrition during specific months, particularly post-summer.
Attrition is defined as the percentage of employees who leave the company over a given period, calculated using the “Schlüter formula”, calculating the averages across different timeframes:
(Total number of exits / (Starting headcount + New joiners)) x 100
Pool Sample Overview
This analysis is based on internal employees with permanent full-time and part-time contracts. It excludes working students, interns, and external contractors.
Our analysis shows a downward trend in attrition from 19.8% in 2023 to 17.3% in 2024 – a positive signal that may reflect better onboarding, employee engagement, or organizational stability.
Key Observations
Over time, the attrition rate has seen a slight decline, from 19.8% in 2023 to 17.3% in 2024. This decrease suggests a trend toward lower turnover, particularly in the second half of 2024. The overall dip in attrition rates is likely influenced by a combination of factors such as internal organizational changes, normal employee turnover, and broader economic factors. The economic landscape in Germany since 2023, characterized by stagnation and political instability, likely contributed to this trend, reducing employees’ mobility and retention.
With peopleIX’s analytics tools, organizations can dive deeper into attrition trends, pinpointing key factors driving turnover.
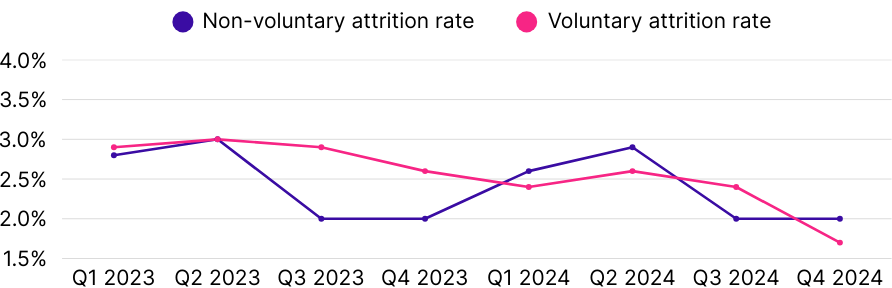
To gain deeper insights into the attrition trend, we broke down exits into voluntary and non-voluntary categories. This distinction allows us to assess whether the shifts are driven by structural organizational changes or by natural employee mobility.
Key Observations
Quarterly correlation: Voluntary and non-voluntary attrition tended to rise and fall together. Monthly pattern: No correlation observed.
Non-voluntary exits: Follow seasonal trends, peaking in March, May, June, and October.
Voluntary exits: Unpredictable, but higher in the first half of the year, often linked to mid-year restructuring efforts.
With peopleIX’s insights, you can monitor your attrition data, understanding both voluntary and non-voluntary exits with a closer, real-time perspective.
What’s the real cost of high attrition? This episode dives into how turnover affects Employee Lifetime Value.
Part 3:
Seniority and Attrition
When analyzing attrition rates by employee seniority, we found that employees with less than 2 years in the company, particularly those with less than 1 year, had the highest attrition rates. This is largely driven by non-voluntary attrition, suggesting that recent hires are more vulnerable to layoffs, particularly during company restructuring or shifting priorities.
Key Observations
For employees with higher tenure (2+ years), non-voluntary attrition is significantly lower (around 30%). The differences in attrition rates between tenure groups highlight the vulnerability of newer hires, while more senior employees appear less impacted by layoffs. We also see that higher seniority roles seem to not follow clear seasonal patterns, possibly due to a different logic in the job market for those positions.
With peopleIX’s data, you can identify turnover patterns by seniority, helping your organization refine retention strategies and focus on high-risk groups.
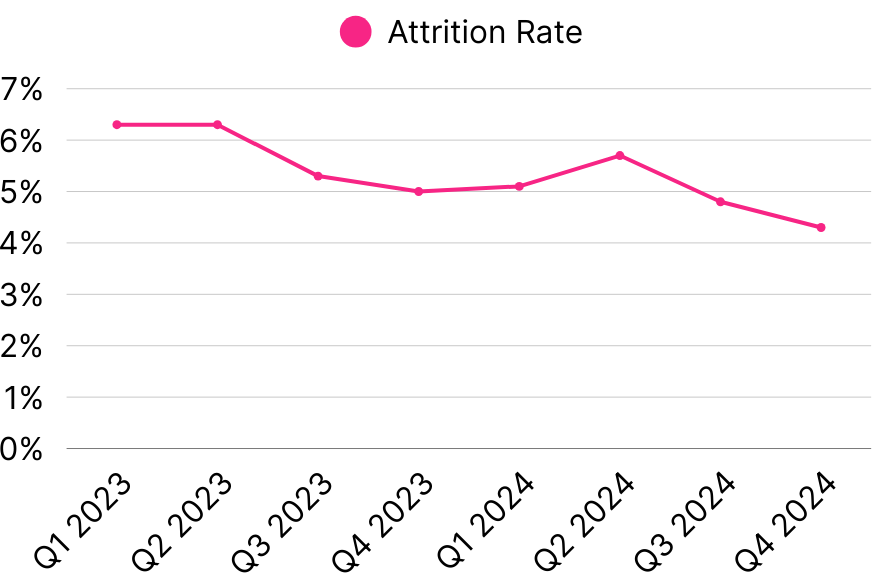
Attrition patterns also show strong seasonal tendencies, with higher rates typically observed in the first two quarters of the year, followed by a sharp decrease in the latter half.
Key Observations
Attrition rates are generally higher in the first two quarters (Q1 and Q2) and decrease sharply in the second half of the year (Q3 and Q4). This trend is especially evident in non-voluntary exits, suggesting that companies may be adjusting their workforce structures early in the year to meet strategic and financial targets — assuming a fiscal year start around January or April, which is common practice.
Compare different time periods with peopleIX’s new time range feature, uncover trends, and get a better grip on how attrition evolves in your organization.
Departments & macro areas: overall grouping of attrition rate
Key Observations
Finance & Accounting and Sales & Marketing show the highest attrition in 2024, both at 23.2%, though down from 26.1% and 25.6% in 2023. General Management increased from 16.1% to 18.8%, while Operations dropped from 18.6% to 14.6%.People & Culture declined from 18.3% to 13.8%, and IT saw the sharpest drop from 14.6% to 7.8%. Engineering remained low but rose slightly from 8.2% to 9.6%. High attrition remains concentrated in commercial and leadership roles, while tech and support functions show increasing stability.
These advanced insights help HR teams proactively design retention programs and reduce churn.
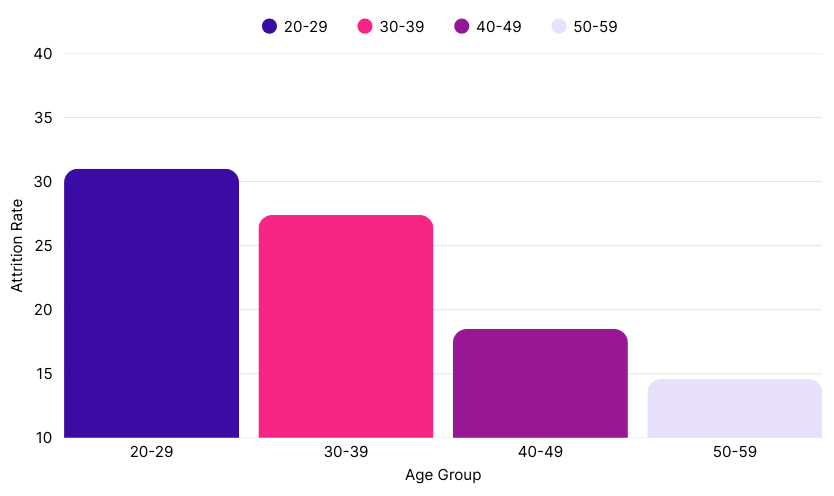
When examining attrition across age groups, younger employees (20-39 years) were more likely to leave voluntarily, while older age groups (40-59 years) showed higher levels of non-voluntary attrition.
Key Observations
Voluntary attrition is predominantly driven by younger age groups (20-39 years), while non-voluntary attrition is more common among the 40-59 age groups, likely reflecting targeted restructuring efforts and layoffs.
With peopleIX’s powerful segmentation capabilities, track attrition rates by age group and implement personalized retention strategies.
When examining attrition across age groups, younger employees (20-39 years) were more likely to leave voluntarily, while older age groups (40-59 years) showed higher levels of non-voluntary attrition.